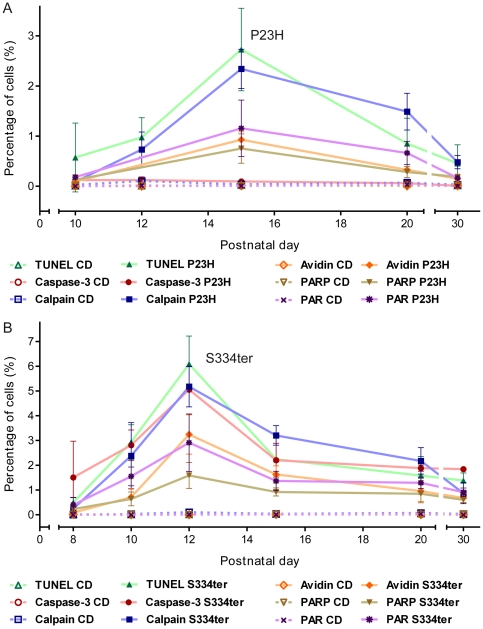
Figure 3. Progression of metabolic cell death markers during 1st postnatal month.
Percentage of labelled ONL cells in (A) P23H and (B) S334ter transgenic rats. While in both RP animal models, most markers analysed peaked together with cell death as evidenced by the TUNEL assay, activation of caspase-3 was absent in P23H retina but present in S334ter retina. In both mutants, calpain activity showed a delayed regression after the peak of cell death. Values are mean ± SD from at least three different animals. All mean ± SD and P values are consigned in the table S1.

