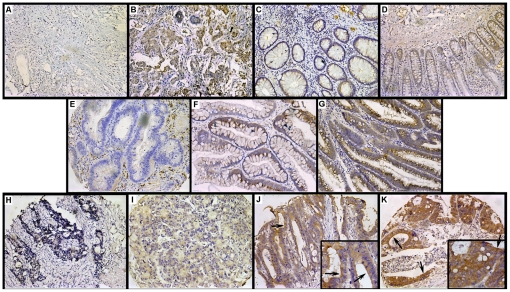
Figure 2. Immunohistochemical analysis of TSP50 in colorectal tissue microarrays.
(A) The breast carcinoma section that was incubated with PBS served as negative control; (B) The breast carcinoma section that was incubated with antibodies to TSP50 served as positive control; (C–D) A sample of TSP50 expression levels in colorectal normal tissues: − in C and 1+ in D; (E–G) A sample of TSP50 expression levels in colorectal adenomas: − in E, 1+ in F and 2+ in G; (H–K) A sample of TSP50 expression levels in CRCs: − in H, 1+ in I, 2+ in J and 3+ in K; some CRC samples exhibited membrane staining (arrows in J and K). Original magnification, ×200 in A–K and ×400 in inset.

