
Figure 4.
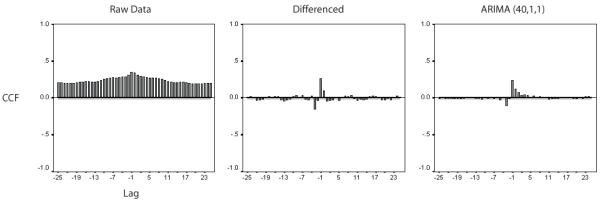
Cross correlation functions (CCF) calculated between sensors #70 and #54. The far left graph demonstrates values calculated between raw data, while the middle graph illustrates cross correlation calculated between differenced time series and the far right graph illustrates crosscorrelation calculated between time series after ARIMA (40,1,1) modeling. The positive CCF calculated using raw data reflects the autocorrelation structure of individual sensor time series. The middle CCF demonstrates the temporal focusing of cross correlation, though oscillatory waves achieve significance across the time lags. The CCF following ARIMA modeling illustrates a temporally focused interaction, though still exceeding the 95% confidence intervals as noted by the horizontal lines.