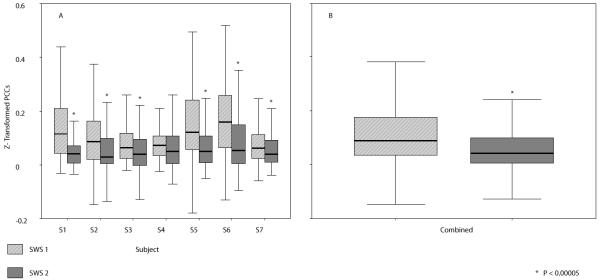
Figure 9.
Flying box displays of the means and distributions of SWS1 and SWS2 z-transformed PCCs in A individual subjects and B combined across subjects, for those interactions significant on average across subjects in SWS1. Outliers and extreme outliers are not displayed. As negative PCCs within this subset were sparse and inconsistent across subjects, both positive and negative data were included for all 237 interactions in each subject.

