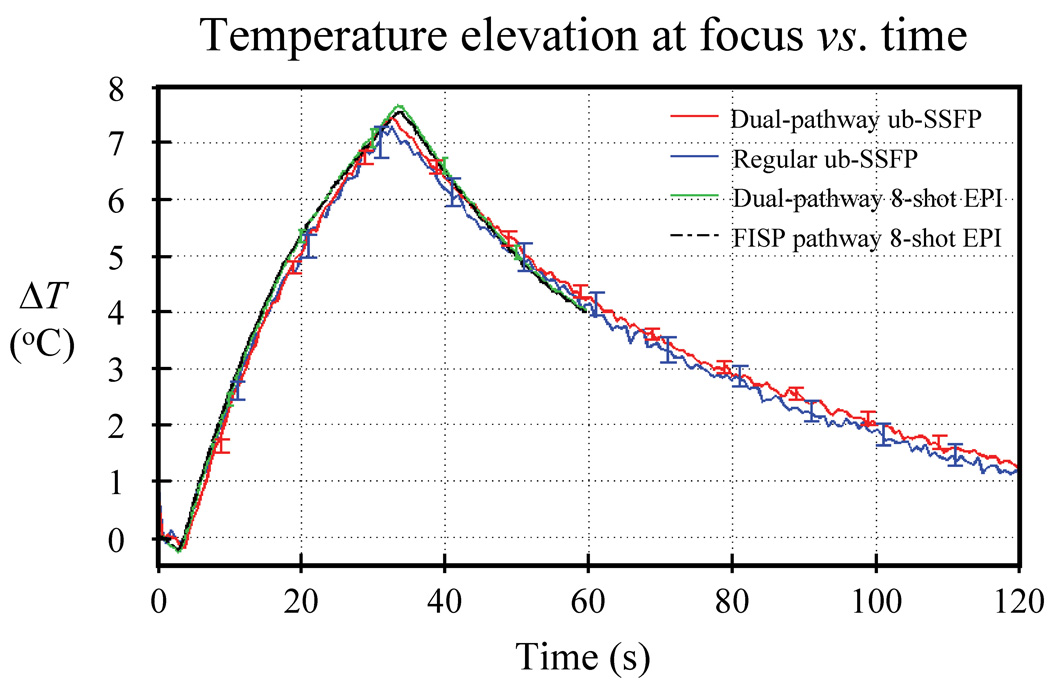
Fig. 10.
Temperature curves are shown for all three types of sequences from Fig. 9, as averaged over a 3×3 pixel ROI located at focus. Five repeat-datasets were acquired with each sequence, the average value among repeats was plotted and the standard deviation among repeats was used to generate error bars. Very close temperature agreement was obtained between all three imaging sequences (dual pathway ub-SSFP, regular ub-SSFP and dual-pathway EPI). On average, the curves plotted here differed from each other by only 0.21 °C or less. As a reference, temperature measurements from the usual (FISP) pathway of the dual-pathway EPI sequence are also shown, averaged over all five repeats.

