
Figure 1.
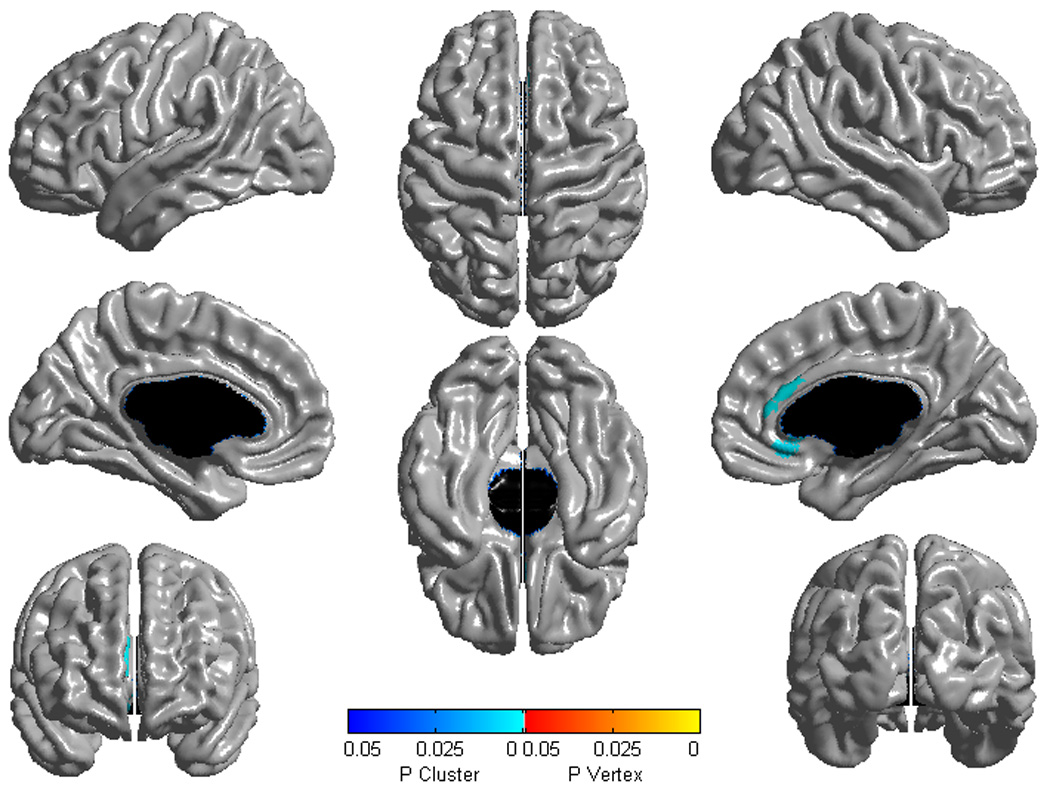
Brain areas where local cortical thickness is associated with CBCL Aggressive Behavior raw scores in a second-order (quadratic) model over the whole sample (n=193). Random field theory was used to correct for multiple comparisons over the whole cortical mantle.
Figure is shown at p≤0.05, RFT corrected. Blue areas are significant at the cluster level and red color corresponds to areas significant at the vertex level (none in this figure). Controlled for age, gender, scanner and total brain volume.