Figure 1.


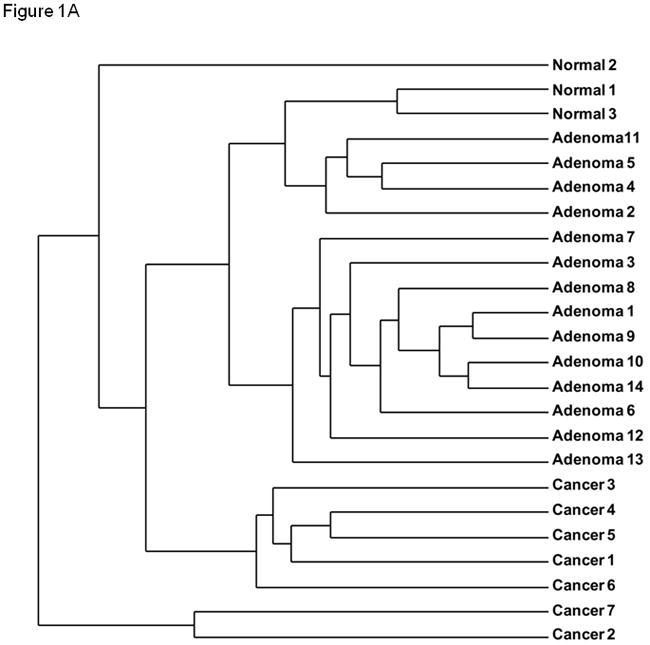
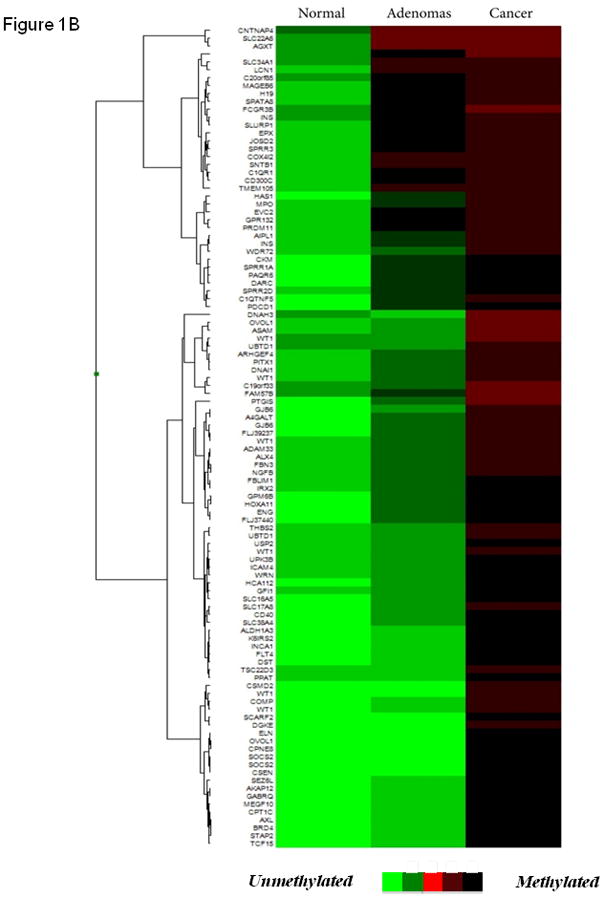
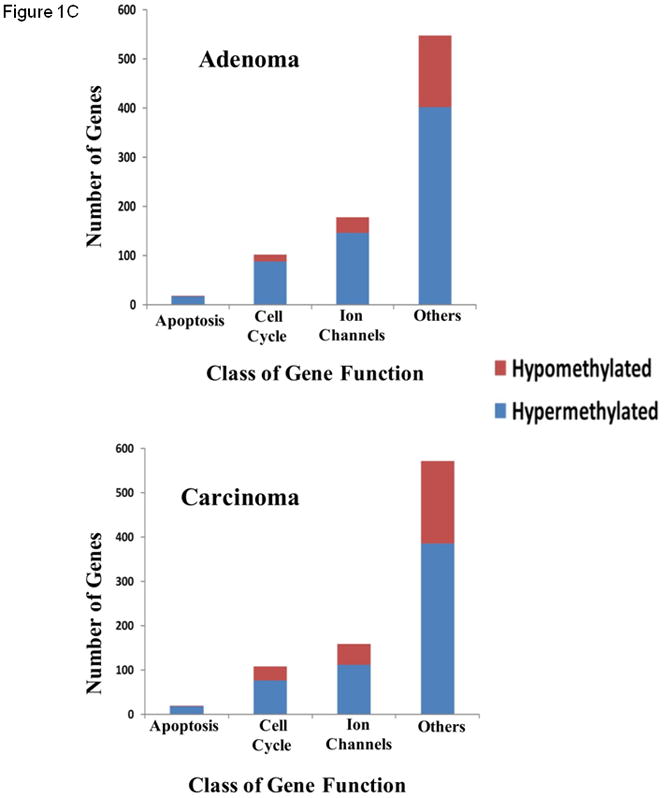
(A) Unsupervised hierarchical clustering of parathyroid specimens analyzed using the genome-wide DNA methylation platform (Illumina Infinium HumanMethylation27 BeadChip). (B) Heat map of unsupervised top 100 differentially methylated CpG islands. Green indicated unmethylated genes (β-value ≤ 0.2), whereas red indicates hypermethylated genes (β-value ≥ 0.6). (C) Functional annotation of genes differentially methylated (diff. β-value ≥ 0.25 and p < 0.05) in parathyroid adenomas (top) and carcinomas (bottom) compared with normal parathyroid tissue.
