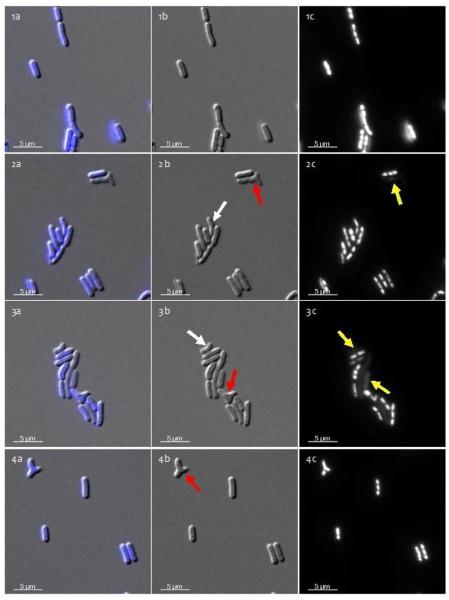
Figure 2.
Microscopic observation of S. IU 625 with various HgCl2 concentration treatments at 12 hours. Column a: overlaid images; Column b: DIC images; Column c: DAPI-stained images. 1a-1c: 0.0 mg/L HgCl2 (control); 2a-2c: 0.1 mg/L HgCl2; 3a-3c: 0.5 mg/L HgCl2, and 4a-4c: 1.0 mg/L HgCl2. Yellow arrows indicate cells lacking DNA; white arrows indicate curved cells; red arrows indicate ectopic poles.

