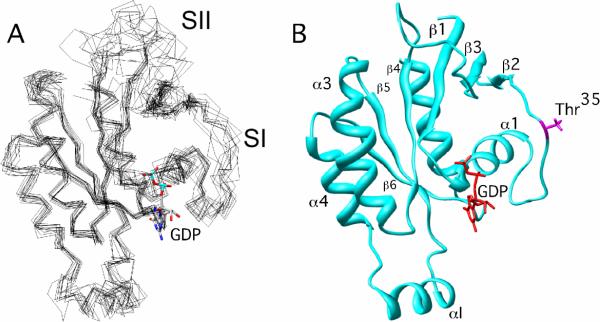
Figure 1.
Structure of Cdc42(T35A)-GDP. The 12 lowest energy structures were superimposed relative to the average structure generated using Xplor-NIH. They were visualized using Chimera (33). The GDP nucleotide was superimposed onto the structure(s) using coordinates from the X-Ray crystal structure of Cdc42 wild-type (1AN0.pdb). (A) All 12 twelve structures overlaid with each other, and (B) The most representative structure, as defined by OLDERADO (36).

