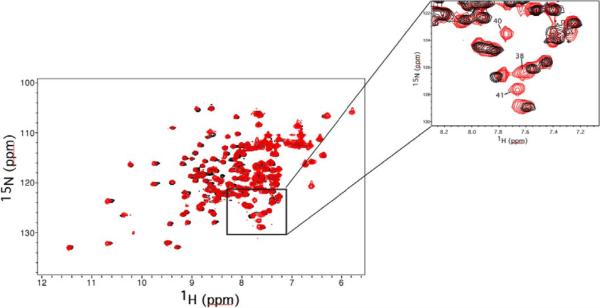
Figure 4.
2D 15N-HSQC of Cdc42wt (black) overlaid with Cdc42T35A (red). The inset (upper right corner of figure) highlights a region of the spectrum containing resonances from three residues on the C-terminal portion of the Switch 1 region of Cdc42T35A (Residues 38, 40 and 41). These resonances are well defined in the Cdc42T35A spectrum, but could not be detected in the HSQC spectrum of Cdc42wt due to excessive line broadening (18).

