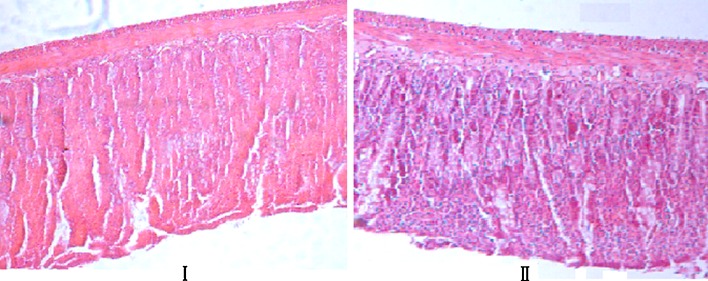
Fig. 2.
Histopathological comparison between test and control rats. Light micrograph samples were taken at 5 h after oral gavage administration of drugs (original magnification, ×100). I Control, oral gavage administration of BBR. II Test, oral gavage administration of BBR formulation containing 2.5% TPGS. The BBR doses were all 100 mg kg−1

