Abstract
The aim of the current work was the design and evaluation of etodolac controlled porosity osmotic pump (CPOP) tablets exhibiting zero-order release kinetics. Variables influencing the design of (1) core tablets viz., (a) osmogent type (sodium chloride, potassium chloride, mannitol, and fructose) and (b) drug/osmogent ratio (1:0.25, 1:0.50, and 1:0.75), and (2) CPOP tablets viz., (a) coating solution composition, (b) weight gain percentage (1–5%, w/w), and (c) pore former concentration (5%, 10%, and 20%, v/v), were investigated. Statistical analysis and kinetic modeling of drug release data were estimated. Fructose-containing core tablets showed significantly (P < 0.05) more retarded drug release rates. An inverse correlation was observed between drug/fructose ratio and drug release rate. Coating of the optimum core tablets (F4) with a mixture of cellulose acetate solution (3%, w/v), diethyl phthalate, and polyethylene glycol 400 (85:10:5, v/v, respectively) till a 4% w/w weight gain enabled zero-order sustained drug delivery over 24 h. Scanning electron microscopy micrographs of coating membrane confirmed pore formation upon contact with dissolution medium. When compared to the commercial immediate-release Napilac® capsules, the optimum CPOP tablets (F4–34) provided enhanced bioavailability and extended duration of effective etodolac plasma concentration with minimum expected potential for side effects in healthy volunteers.
KEY WORDS: cellulose acetate, controlled porosity osmotic pump, etodolac, osmogent, zero order
INTRODUCTION
Etodolac is a non-steroidal anti-inflammatory drug (NSAID) acting by a preferential inhibition of cyclo-oxygenase-2 (COX-2) enzyme. It is used for rheumatoid arthritis, including juvenile idiopathic arthritis, osteoarthritis, and for the treatment of acute pain. It has an elimination half-life of 7 h, and the recommended oral dose, 200 to 400 mg, is given every 6 to 8 h to a maximum of 1.2 g daily (1). To provide the desired drug concentration at the absorption site allowing maintenance of plasma concentrations within the therapeutic range and reducing the dosing frequency, controlled-release preparations for once-daily use are desirable.
Per-oral controlled release osmotic systems represent a major group of dosage forms that utilize the principles of osmotic pressure for the delivery of drugs. The first introduced osmotic system was the elementary osmotic pump (EOP) developed by Theeuwes (2). The EOP consists of (a) an osmotic core that contains the drug along with an osmogent and (b) a semi-permeable membrane coating with a delivery orifice. Upon contact with the aqueous fluids, the EOP imbibes water at a definite rate that depends on the membrane fluid permeability and the osmotic pressure of the osmotic core. In fact, the saturated solution of the drug within the core would be the driving force for drug delivery at a controlled rate from the delivery orifice in the membrane. However, the EOP was not a suitable system for delivering those drugs having low aqueous solubility (3,4).
The bilayer push–pull osmotic pump (PPOP) tablets were introduced in an attempt to overcome this limitation. The PPOP consists of two compartments; the drug is present in the upper compartment, whereas the osmotic agent is present in the lower compartment. Upon contact with the aqueous fluids, the osmotic compartment swells. This would be the driving force that pushes the drug in the form of a fine dispersion at a controlled rate via the delivery orifice in the membrane. However, the large-scale production of PPOP is an expensive process because it depends on laser drilling and requires the application of a complicated drug layer identification technology to ensure orifice drilling on the surface of drug layer after coating (5,6).
Subsequently, controlled porosity osmotic pump (CPOP) systems were introduced. The CPOP system consists of (a) an osmotic core that contains the drug along with an osmogent and (b) a semi-permeable membrane coating that contains a water-soluble pore-forming agent, instead of the delivery orifice associated with the previous designs. Upon contact with the aqueous fluids, the pore-forming agent dissolves resulting in an in situ formation of a microporous membrane that is substantially permeable to both water and dissolved solutes (7–9). It was reported that the rate of drug release from these systems depends on the thickness of the semi-permeable membrane coating, the level of the pore-forming agent in coating, the drug solubility in the tablet core, and the osmotic pressure difference across membrane (10).
In the current work, the formulation variables influencing the design of etodolac core tablets were reported. Coating of the best achieved core formula (F4) with mixtures of (a) cellulose acetate (CA) solution (2%, 3%, and 4%, w/v), (b) diethyl phthalate (DEP), and (c) polyethylene glycol 400 (PEG 400), in different ratios, was further investigated in an attempt to design CPOP tablets with zero-order drug release kinetics. Finally, the in vivo oral drug absorption from the best achieved CPOP tablet as well as the commercially available immediate-release Napilac® capsules (Global Napi Pharmaceuticals (GNP), 6th of October City, Egypt) was investigated in four healthy human volunteers.
MATERIALS AND METHODS
Materials
Etodolac was kindly provided by GNP (6th of October City, Egypt). Potassium dihydrogen phosphate, disodium hydrogen phosphate, and fructose were provided by Merck (Darmstadt, Germany). Acetonitrile and phosphoric acid (HPLC grade) were purchased from Sigma Aldrich (St. Louis, MO, USA). Mannitol was from Blackburn Distributions LTD (Lancashire, England). Magnesium stearate was from CG Chemikalien (Laatzen, Germany). Microcrystalline cellulose (Avicel® PH101) was from FMC Corporation (Philadelphia, USA). Cellulose acetate was from Prolabo (Paris, France). Diethyl phthalate was from Veb Laborchemie (Apolda, Germany). Talc, potassium chloride, sodium chloride, and ethanol were from El-Nasr Pharmaceutical Chemicals Co. (Abu Zaabal, Egypt). Other chemicals (analytical grade) were used as received.
Preparation of Etodolac Core Tablets
Six core tablet formulae (F1–F6), each containing 200 mg etodolac, were prepared by direct compression using a single punch tablet press machine (Royal artist, Bombay, India) equipped with concave punches (10.0 mm). The respective powders, shown in Table I, including the drug (etodolac), an osmogent (fructose, mannitol, potassium chloride, or sodium chloride), and a filler (Avicel® PH101) were separately passed through sieve no. 20. The sieved powders were mixed for 10 min using a pestle and mortar. Finally, the lubricants (magnesium stearate and talc) were added and gently mixed for another 3 min with the previously blended powders. Accurate weights of 400 mg of each mixture were pressed in the tablet press machine to produce the desired core tablets. The tablet hardness was kept constant in all batches at 10 kg/cm2 using a Monsanto hardness tester (St. Louis, MO).
Table I.
The Composition (milligrams) of the Investigated Etodolac Core Tablets
| Form. code | Drug | Sodium chloride | Potassium chloride | Mannitol | Fructose | Avicel® PH101 | Talc | Mg stearate |
|---|---|---|---|---|---|---|---|---|
| F1 | 200 | 50 | 142 | 4 | 4 | |||
| F2 | 200 | 50 | 142 | 4 | 4 | |||
| F3 | 200 | 50 | 142 | 4 | 4 | |||
| F4 | 200 | 50 | 142 | 4 | 4 | |||
| F5 | 200 | 100 | 92 | 4 | 4 | |||
| F6 | 200 | 150 | 42 | 4 | 4 |
In Vitro Evaluation of the Prepared Core Tablets
Physicochemical Characterization of the Tablets
Random tablets were selected from each batch (representing each formula) and were accurately weighed using an electronic balance (Sartorius GmbH, Gottingen, Germany). The thickness of the tablets was determined using a vernier caliper (For-bro Engineers, Mumbai, India). The results are expressed as mean values (± S.D.) of 20 and 10 tablets, respectively. According to BP specifications (11), 16 tablets (representing a sample corresponding to as nearly as possible to 6.5 g) were dedusted and placed in the drum of a tablet friabilator (FAB-2, Logan Instruments Corp., NJ, USA) adjusted to rotate at a speed of 25 rpm. After 4 min, the tablets were removed, dedusted, and accurately weighed. The percent weight loss was determined relative to their original weight. The drug content uniformity within tablets was determined spectrophotometrically (1601-PC Double beam spectrometer, Shimadzu, Kyoto, Japan) at a wavelength of 278 nm. Briefly, ten tablets were randomly selected. Each tablet was crushed using a pestle and mortar. Subsequently, the powdered tablet was extracted in Sorensen’s phosphate buffer (pH 7.4, 100 ml). The solution was filtered, and the drug content was determined after a suitable dilution with the same buffer. The results are expressed as mean values (± S.D.) of ten samples.
Drug Release Studies
The drug release studies were performed in a USP Dissolution Tester Apparatus, type-I (VK 7000 Dissolution Testing Station, Vankel Industries, Inc., NJ, USA) at 37 ± 0.5°C. The dissolution medium was Sorensen’s phosphate buffer (pH 7.4, 900 ml) throughout the study period (11). The investigated formulae and etodolac core tablets as well as the commercially available Napilac® 200 mg capsules (GNP, 6th of October City, Egypt) were placed within the baskets that rotated at a speed of 100 rpm (11). At definite time intervals, aliquot samples (5 ml) from the dissolution medium were withdrawn and filtered through a cellulose acetate membrane (0.45 μm). Replacement with an equal volume of fresh medium was done at each time of withdrawal. The drug content of each sample was determined as previously described. The time required for 50% drug release (t50%) from each formula was calculated. The results are expressed as mean values (± S.D.) of three determinations. The data were statistically analyzed (SPSS 14.0, Chicago, USA) applying one-way ANOVA at P value <0.05. Post hoc multiple comparisons between formulae were performed using the least square difference test.
Kinetic Modeling of Dissolution Profiles
The dissolution profiles of the drug from all formulae in Sorensen’s phosphate buffer (pH 7.4) were fitted to zero-order, first-order, and Higuchi models (12). The model with the highest correlation coefficient was considered to be the best fitting one.
Preparation of Etodolac CPOP Tablets
The best achieved core tablets (formula F4) were coated in a spray coating pan (Karishma Pharma Machines, Mumbai, India). The coating solutions were mixtures of CA solutions (2%, 3%, and 4%, w/v), DEP, and PEG 400 in different ratios; 85:10:5, 80:10:10, and 70:10:20 (v/v), respectively. The composition of the investigated etodolac CPOP tablets is shown in Table II.
Table II.
The Composition (%) of the Coating Solutions of the Investigated Etodolac CPOP Tablets
| Form. code | Coating solution composition (CA/DEP/PEG 400, %, v/v) | CA concentration (%, w/v) | Weight gain (%, w/w) |
|---|---|---|---|
| F4–21 | 85:10:5 | 2 (Solution A2) | 1 |
| F4–22 | 2 | ||
| F4–23 | 3 | ||
| F4–24 | 4 | ||
| F4–25 | 5 | ||
| F4–31 | 3 (Solution A3) | 1 | |
| F4–32 | 2 | ||
| F4–33 | 3 | ||
| F4–34 | 4 | ||
| F4–35 | 5 | ||
| F4–41 | 4 (Solution A4) | 1 | |
| F4–42 | 2 | ||
| F4–43 | 3 | ||
| F4–44 | 4 | ||
| F4–45 | 5 | ||
| F4–34a | 80:10:10 | 3 (Solution B) | 4 |
| F4–34b | 70:10:20 | 3 (Solution C) | 4 |
CA cellulose acetate solution, DEP diethyl phthalate, PEG 400 polyethylene glycol 400
CA solutions were prepared in a 4:1 mixture of dichloromethane and methanol (7). To study the influence of coating thickness on drug release, the average weight gain after coating was controlled at different levels (1–5% weight gain; 9). Initially, the tablets were preheated by passing hot air through the tablet bed while the pan was rotating at a speed of 10 rpm. Following, the coating process started with a rotation speed of 30 rpm. The spray rate, the atomizing air pressure, and the inlet air temperatures were 4–5 ml/min, 2 kg/cm2, and 50°C, respectively. Coated tablets were dried overnight at 50°C to remove the residual solvent (5,7). The in vitro release studies of the coated tablets were conducted, in triplicate, for every 1% weight gain. The percentage of drug released after 1 h (Q1 h), after 12 h (Q12 h), and the time required for 50% drug release (t50%) was determined. Statistical analysis of data and kinetic modeling of dissolution profiles were conducted as mentioned previously.
Scanning Electron Microscopy
Scanning electron microscopy (SEM) micrographs of the coating membrane of the formula (F4–34) were taken, before and after conducting the dissolution studies, in order to examine the effect of PEG 400 as a pore-forming agent. Briefly, a piece of the coating membrane was removed from the tablet core, fixed on an SEM sample holder with double-sided adhesive tape, and coated with a layer of gold (150 Aº) for 2 min using a sputter coater (Edwards S-150A, England). The sample was then examined using a scanning electron microscope (Jeol JSM T20, Tokyo, Japan).
Pilot Pharmacokinetic Studies in Healthy Volunteers
Study Design
A non-blind, two-treatment, two-period, randomized, crossover study was carried out to compare the pharmacokinetics of etodolac following oral administration of single doses (200 mg) of the immediate-release Napilac® capsules (GNP, 6th of October City, Egypt), treatment A, and the best achieved CPOP tablets (formula F4–34), treatment B. The study protocol was approved by the research ethics committee for experimental and clinical studies at the Faculty of Pharmacy, Cairo University, Egypt. The protocol complies with the Code of Ethics of the World Medical Association (Declaration of Helsinki) for humans.
Four non-smoking male volunteers were invited to participate in the study after giving informed written consent describing the drug, the nature, and the importance of the study in advance. The volunteers ranged in height from 160 to180 cm (172 ± 8.64 cm), in weight from 70 to 85 kg (76 ± 6.68 kg), and in age from 25 to 33 years (28 ± 3.83 years).
Prior to the study, the volunteers were examined by expert physicians to investigate their medical history, conduct the necessary physical examinations, and perform complete hematological and biochemical laboratory analyses. The volunteers were prohibited from taking medicines for 1 week prior to the beginning of the study till its end.
On the study day, the assigned treatments were ingested with water (200 ml) on two phases: On phase I, two volunteers received treatment A (Reference) and the remainder received treatment B. The volunteers were fasted overnight; the food was allowed 4 h post-dosing. A washout period of 1 week separated the phases. On phase II, the reverse of randomization took place. Venous blood samples (5 ml) were collected into heparinized tubes, by an expert physician, at the following time points: 0 (pre-dose), 0.5, 1, 2, 3, 4, 6, 8, 12, and 24 h after administration of each treatment. The plasma was centrifuged, pipetted into glass tubes, and frozen at −20°C until analysis.
Chromatographic Conditions
Plasma concentrations of etodolac were determined using a previously described HPLC procedure (13) with slight modifications. The mobile phase consisted of a mixture of acetonitrile/water/phosphoric acid (500:500:0.25, v/v) with UV detection at 274 nm. The flow rate was adjusted at 1.5 ml/min. Pioglitazone hydrochloride was used as an internal standard. Separation of the peaks was achieved on a reverse-phase micro-particulate Bondapack C18 HPLC column (25 cm × 4.6 mm) with a particle size of 10 μm (Waters Corp., Milford, MA, USA). Under the described conditions, the retention times of etodolac and pioglitazone hydrochloride peaks were 4.5 and 7.9 min, respectively.
Standard Solutions
Blank plasma samples were spiked with etodolac (0.05–20 μg/ml) and pioglitazone hydrochloride (5 μg/ml) standard solutions in methanol. Aliquots of spiked plasma samples (100 μl) were mixed with acetonitrile (200 μl) to precipitate plasma proteins. These mixtures were vortexed and then centrifuged. A volume of the supernatant (50 μl) was directly injected into the HPLC column. Peak areas of the drug and the internal standard were determined, in triplicate, using a C-R6A chromatopac Shimadzu integrator. A linear standard curve (R2 = 0.997) was constructed by plotting the peak-area ratios of etodolac to pioglitazone hydrochloride against etodolac concentrations in plasma. The lower limit of quantification was 0.05 μg/ml.
Pharmacokinetic Analysis
A non-compartmental analysis using a special computer program, WinNonlin® (Ver. 1.5, Scientific consulting, Inc., Cary, NC, USA), was adopted to estimate the pharmacokinetic parameters of etodolac following oral administration of the two treatments by each volunteer. The individual plasma concentration–time curves were used to estimate the maximum drug concentration (Cmax, μg/ml), the time to reach Cmax (Tmax, h), the mean residence time (MRT, h), and the elimination half-life (t50%, h). The trapezoidal rule method was suggested to calculate the area under the curve from zero to 24 h (AUC(0–24), μg h/ml). On the other hand, the area under the curve from zero to infinity (AUC(0–∞), μg h/ml) was calculated using Eq. (1):
 |
1 |
Where, Ct is the drug plasma concentration observed at time t and Ke is the apparent elimination rate constant. The relative bioavailability (%) was determined using Eq. (2):
 |
2 |
Statistical Analysis
A two-way ANOVA was performed at P value <0.05, as previously described, to investigate the statistical significance among treatments for the data derived from the pharmacokinetic parameters; Cmax, MRT, and elimination t50%. The selection of the sample size (n, the number of volunteers) was based on economic considerations (14,15).
RESULTS AND DISCUSSION
Physicochemical Characterization of Etodolac Core Tablets
The physicochemical properties of the investigated etodolac core tablets are shown in Table III. The thickness of all tablet batches was relatively small; ranging from 1.90 ± 0.08 to 2.08 ± 0.07 mm. An average thickness of 2 mm would improve patient compliance; some patients have problems with swallowing thick and large tablets. All the tablet formulae complied with the pharmacopoeial specifications for weight variation, friability, and drug content uniformity. The average weight of the tablets was in close approximation to the theoretical weight viz. 400 mg. Statistical analysis of data revealed no significant difference (P < 0.05). A coefficient of variation of less than 3% could indicate compliance with the USP 32 (13) requirements for weight variation tolerance. A good mechanical resistance would be expected for all formulae as a result of their low friability (<1%). Drug content uniformity results (ranging from 95.81 ± 0.66 to 104.88 ± 0.77) could be an indication to the suitability of the utilized technique for powder mixing to prepare etodolac core tablets.
Table III.
Physicochemical Properties of the Investigated Etodolac Core Tablets
| Form. code | Tablet weight (mg) | Tablet thickness (mm) | Tablet friability (%) | Drug content (%) |
|---|---|---|---|---|
| F1 | 398.16 ± 1.34 | 1.95 ± 0.04 | 0.34 ± 0.12 | 96.27 ± 0.65 |
| F2 | 396.12 ± 1.27 | 1.90 ± 0.08 | 0.31 ± 0.18 | 98.11 ± 0.21 |
| F3 | 408.31 ± 1.20 | 2.07 ± 0.01 | 0.51 ± 0.14 | 97.14 ± 0.71 |
| F4 | 398.30 ± 3.00 | 1.93 ± 0.02 | 0.29 ± 0.10 | 102.15 ± 0.48 |
| F5 | 394.13 ± 2.12 | 1.98 ± 0.10 | 0.36 ± 0.17 | 95.81 ± 0.66 |
| F6 | 403.16 ± 1.63 | 2.08 ± 0.07 | 0.21 ± 0.11 | 104.88 ± 0.77 |
The Influence of Osmogent Type on the Drug Release from Core Tablets
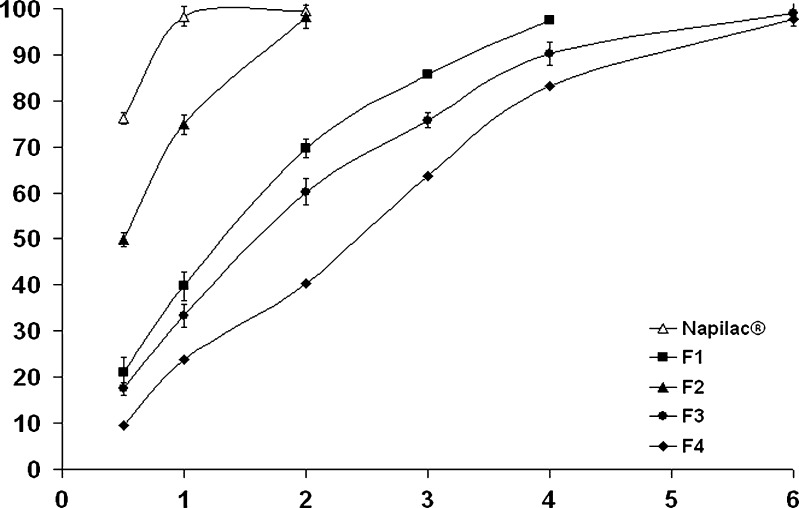
Figure 1 shows the drug release profiles from the formulae F1–F4 as well as the commercially available Napilac® capsules. It is clear that 98.32 ± 2.48% of the drug was released from Napilac® capsules within 1 h. On the other hand, the rate of drug release from the prepared core formulae (F1–F4) was dependent on the employed osmogent.
Fig. 1.
The influence of osmogent type on in vitro drug release from the formulae F1–F4 in Sorensen’s phosphate buffer (pH 7.4) at 37 ± 0.5°C (mean ± S.D., n = 3)
Four osmogents were investigated: sodium chloride, potassium chloride, mannitol, and fructose. The first two members are water-soluble salts of inorganic acid, while the latter ones belong to the carbohydrates group. Higher drug release rates (t50% = 0.51, 1.34 h) was observed for those tablets containing potassium chloride (formula F2) and sodium chloride (formula F1), respectively. Significantly (P < 0.05) more prolonged drug release rates were observed with the formulae F3 and F4 (t50% = 1.67 and 2.22 h, respectively). The highly ionic nature of sodium chloride and potassium chloride is suggested to increase the driving force required to push the drug out of the tablet (16). In a parallel line, the lower release rate for the tablets containing fructose and mannitol could be related to their much lower osmotic activity as a result of their non-ionic nature (17). As shown in Table IV, the drug release profiles could be best fitted with Higuchi diffusion model. Based on these results, formula F4, which provided more retardation of the drug release rate, was chosen for further studies.
Table IV.
Mathematical Modeling and Release Kinetics of Etodolac from the Investigated Core and CPOP Tablets
| Form. code | Zero-order plots correlation coefficients (R 2) | First-order plots correlation coefficients (R 2) | Higuchi’s plots correlation coefficients (R 2) | The best fitting model | t 50% (h) |
|---|---|---|---|---|---|
| F1 | 0.954 | 0.945 | 0.991 | Higuchi diffusion | 1.343 |
| F2 | 0.957 | 0.981 | 0.986 | 0.510 | |
| F3 | 0.896 | 0.952 | 0.972 | 1.671 | |
| F4 | 0.956 | 0.939 | 0.986 | 2.228 | |
| F5 | 0.916 | 0.957 | 0.981 | 1.647 | |
| F6 | 0.883 | 0.873 | 0.966 | 1.101 | |
| F4–23 | 0.991 | 0.993 | 0.994 | 2.740 | |
| F4–24 | 0.919 | 0.968 | 0.971 | 2.951 | |
| F4–25 | 0.942 | 0.980 | 0.981 | 3.872 | |
| F4–33 | 0.914 | 0.989 | 0.995 | 8.289 | |
| F4–34 | 0.990 | 0.894 | 0.976 | Zero order | 11.205 |
| F4–35 | 0.992 | 0.933 | 0.972 | 11.831 | |
| F4–43 | 0.992 | 0.974 | 0.970 | 15.790 | |
| F4–44 | 0.993 | 0.991 | 0.966 | 17.887 | |
| F4–45 | 0.992 | 0.966 | 0.895 | 23.623 | |
| F4–34a | 0.957 | 0.994 | 0.998 | Higuchi diffusion | 5.220 |
| F4–34b | 0.872 | 0.951 | 0.961 | 2.700 |
The Influence of Drug: Osmogent Ratio on the Drug Release from Core Tablets
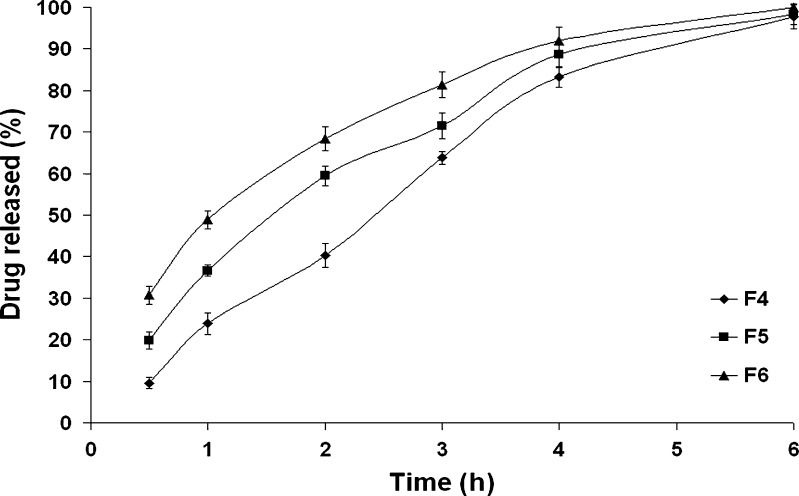
Three drug-to-osmogent ratios (1:0.25, 1:0.50, and 1:0.75) were investigated (formulae F4, F5, and F6, respectively). As shown in Fig. 2, a direct correlation was observed between the amount of fructose and the drug release rate. Kinetic analysis of data revealed that t50% of formula F4 was significantly (P < 0.05) decreased from 2.22 to 1.13 h upon increasing the drug/fructose ratio from 1:0.25 (formula F4) to 1:0.75 (formula F6). The osmotic pressure is a colligative property that depends on the number of discrete entities of solute present in the solution. Possibly, the higher amount of osmogent would lead to a greater osmotic pressure, the driving force to release the drug. For controlling the drug release from these systems, it is important to optimize the osmotic pressure gradient between the core compartment and the external environment (18). Therefore, formula F4 was chosen for further studies.
Fig. 2.
The influence of drug/fructose ratio on in vitro drug release from the formulae F4–F6 in Sorensen’s phosphate buffer (pH 7.4) at 37 ± 0.5°C (mean ± S.D., n = 3)
CPOP Tablets Based on Formula F4
Several CPOP systems were engineered using fructose-based core formula (F4) that were subsequently coated with mixtures of CA, PEG 400, and DEP. CA is a well-known rate-controlling semi-permeable membrane that is permeable to aqueous fluids but impermeable to the components of the core (9). The incorporation of DEP as a water-insoluble plasticizer and PEG as a leachable pore-forming material was suggested to lower the glass transition temperature, increase the polymer-chain mobility, enhance the flexibility, and affect the permeability of CA coating. During dissolution, water is imbibed by the core from the dissolution medium across membrane. Pores are formed in the membrane gradually following dissolution of PEG (18).
The Influence of Weight Gain on the Drug Release from CPOP Tablets
To investigate the effect of weight gain (%, w/w) on etodolac release from CPOP tablets, the cores were coated and the drug release studies were conducted for every 1% (w/w) weight gain. When the tablets were coated till their weight was increased by 1% or 2% (w/w) only, the coats did not remain intact till the end of the dissolution study and eroded after a short period. The lack of resistance of these very thin coating layers could be related to their inability to tolerate the internal pressure exerted by the dissolution of fructose. On the other hand, the coats remained intact throughout the study period when the coating was continued beyond 2% (w/w) weight gain. These firm coating membranes would be expected to resist the expected mechanical destructive forces, around 1.9 N, in GIT of humans (19) and consequently maintain the integrity of osmotic pump tablets (20).
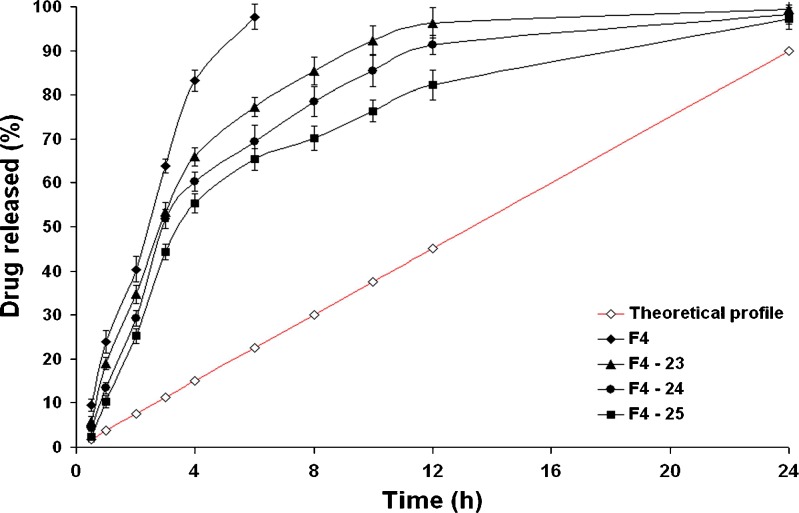
Figure 3 shows the drug release profiles from CPOP tablets coated with solution A2. It is clear that a burst drug release was observed with the formula (F4–23) where Q1 h was 18.95%. This effect was less predominant when the weight gain was 5%, formula (F4–25), where Q1 h was 10.23% only. Unfortunately, these CPOP systems did not succeed to sustain the rate of drug release over 24 h where almost complete drug release was observed after 12 h only. As shown in Table IV, the calculated t50% values were relatively small ranging from 2.740 (formula F4–23) to 3.872 h (F4–25). The higher value of the latter formula could be related to its higher weight gain percentage. Similar observations were reported by Kanagale et al. (7) who concluded that release rate of oxybutynin from CPOP systems decreases with an increase in weight gain percentage of the membrane. Kinetic modeling of the drug release data revealed that all formulae followed Higuchi diffusion model. This suggests that drug diffusion through pores created by the dissolution of PEG 400 is the predominant pathway. In a parallel line, Bi et al. (20) concluded that the drug release from CPOP systems of theophylline is influenced by micro-environmental osmotic pressure created mainly by (a) the dissolution of osmotic agents after water imbibition across the coating membrane and (b) the diffusion through pores created by the dissolution of pore formers incorporated in the coating membrane.
Fig. 3.
The influence of weight gain (%, w/w) on in vitro drug release from formula F4 and CPOP tablets coated with solution A2 in Sorensen’s phosphate buffer (pH 7.4) at 37 ± 0.5°C (mean ± S.D., n = 3)
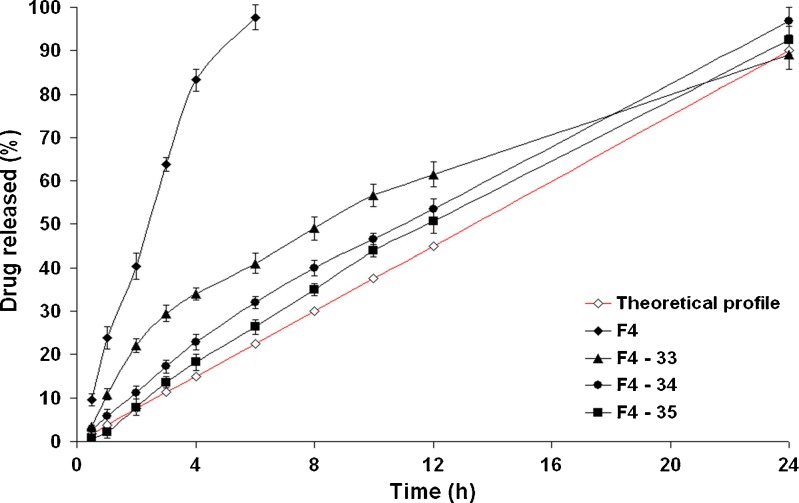
CPOP tablets coated with solution A3 showed more prolonged retardation in the drug release rates than their corresponding formulae coated with solution A2 (Figs. 3 and 4, respectively). Indeed, an inverse correlation could be established between the rate of drug release and the investigated CA solution concentration. In other words, increasing CA solution in the coating membrane would lead to an increase in the t50% values of the drug release profiles. For example, the t50% value was significantly (P < 0.01) increased from 3.872 h (formula F4–25) to 11.831 h (formula F4–35; Table IV). Possibly, the higher the concentration of CA in the coating solution, the higher the membrane resistance to water penetration, the more the reduction in the drug release rate. In a previous study, Shokri et al. (17) proved that thickening the SPM can decrease the rate of water penetration through the membrane resulting in a decrease in the drug release rate. It can be seen from Eq. (4) that release rate from osmotic system is inversely proportional to membrane thickness.
 |
4 |
Fig. 4.
The influence of weight gain (%, w/w) on in vitro drug release from formula F4 and CPOP tablets coated with solution A3 in Sorensen’s phosphate buffer (pH 7.4) at 37 ± 0.5°C (mean ± S.D., n = 3)
Where, dM/dt is drug delivery rate and A and h are the membrane area and thickness, respectively. C is the soluble fraction of the drug, Π is the osmotic pressure of the system, and k is the equation constant (17).
The best fitting kinetic model describing the drug release profiles from the formula (F4–33) was the Higuchi diffusion model. Interestingly, nearly constant drug release rates were observed with those formulae (F4–34) and (F4–35) coated with higher weight gain percentages. Kinetic modeling of drug release data revealed that the zero-order drug release kinetics were obeyed till the end of the study. This suggests that rate of water imbibition across the coating membrane was perfectly controlled so that a saturated solution of fructose in the tablet core was maintained. This would lead to a constant osmotic pressure gradient between the tablet core and the external environment throughout 24 h (21). Post hoc multiple comparisons of data using LSD test revealed that no significant difference (P > 0.05) could be observed between the t50% values (11.205 and 11.831 h) of the formulae (F4–34) and (F4–35), respectively.
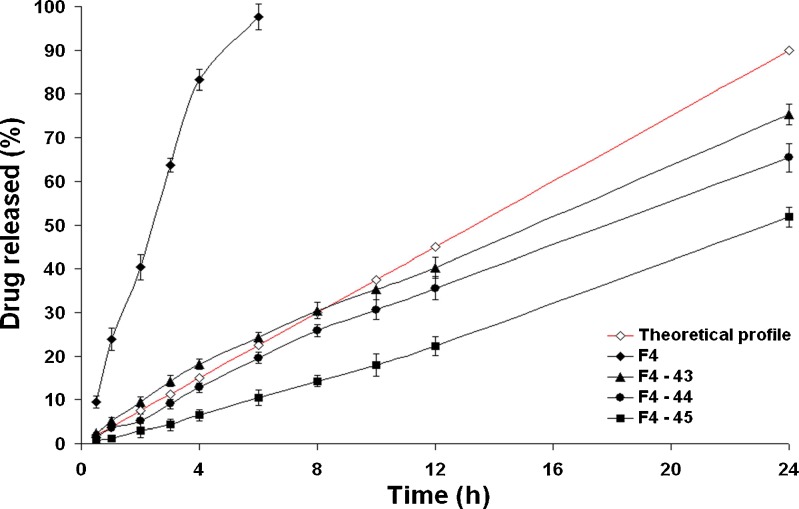
Figure 5 shows the drug release profiles from the CPOP tablets coated with solution A4. Significantly (P < 0.01) lower drug release rates were observed with the formulae coated with solution A4 than their corresponding formulae coated with solution A2 or A3. For example, the t50% value was significantly (P < 0.01) increased from 11.831 (formula F4–35) to 23.623 h (formula F4–45). The Q12 h of the formulae (F4–43), (F4–44), and (F4–45) were only 40.23%, 35.56%, and 22.23%, respectively. Nearly constant drug release rates were observed. However, incomplete drug release patterns were observed after 24 h. This could indicate the strong resistance of the coating membrane (solution A4) to water penetration. Kinetic modeling of data revealed that the zero-order release kinetics were followed throughout the study period.
Fig. 5.
The influence of weight gain (%, w/w) on in vitro drug release from formula F4 and CPOP tablets coated with solution A4 in Sorensen’s phosphate buffer (pH 7.4) at 37 ± 0.5°C (mean ± S.D., n = 3)
For a commercialized osmotic pump tablet, the ideal drug release percentage was supposed to be 90% at 24 h (22). Liu and Che (23) described the ideal zero-order drug release profile with the following Eq. (5):
 |
5 |
Where, F is the cumulative drug released percentage and t is the release time.
As shown in Fig. 4, the drug release profiles of the ideal zero-order system and the CPOP system (F4–34) were comparable; kinetic treatment of data of the latter revealed that zero-order kinetics (R2 = 0.99) were prevailing. The drug released percentages of the CPOP system after 3, 6, 12, and 24 h were significantly (P < 0.05) higher than their corresponding percentages of the ideal zero-order system. The mean cumulative drug released percentage, at any time, could be estimated by multiplying the time with 4.25, instead of 3.75.
To recapitalize, the formula (F4–34) could be considered as a promising CPOP system that succeeded in delivering 94.84% of the drug over 24 h with zero-order drug release kinetics.
The Influence of Pore-Forming Agent Ratio on the Drug Release Profiles
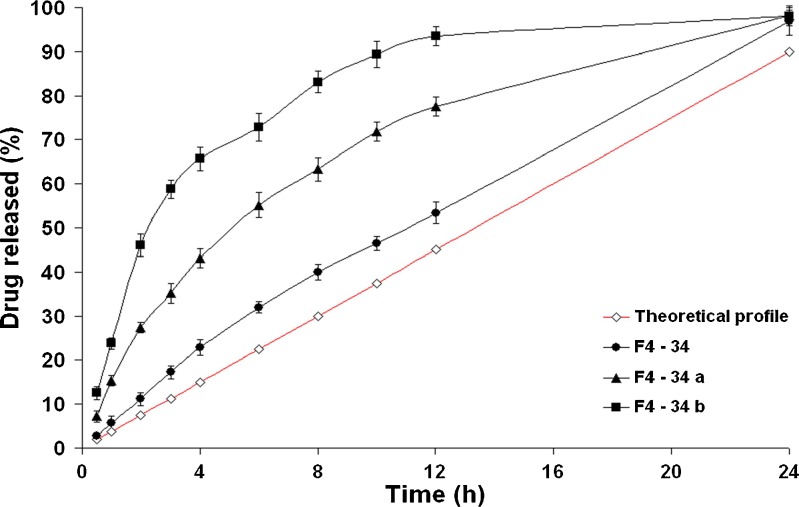
To study the influence of the pore-forming agent ratio on the drug release profiles from the formulae coated using 3% CA solutions (w/v) till 4% weight gain(w/w), three different PEG 400 ratios; 5% (formula F4–34), 10% (formula F4–34a), and 20% (formula F4–34b), v/v, were investigated (Fig. 6). It is clearly evident that the level of PEG 400 had a direct effect on the drug release rate; the higher the pore-forming agent concentration, the faster the drug release rate. The t50% was significantly (P < 0.05) decreased from 11.205 (formula F4–34) to 2.700 h (formula F4–34b). Similar results were reported by Lu et al. (24) and Liu and Xu (5). This behavior could be related to the hydrophilic nature of PEG 400. After coming into contact with the aqueous environment, the higher PEG 400 levels would leach out the membrane easily, resulting in more porous structures and faster drug release rates. Kinetic modeling of data revealed that the drug release profiles of formulae (F4–34a) and (F4–34b) containing higher PEG 400 levels followed Higuchi diffusion model (Table IV).
Fig. 6.
The influence of PEG 400 ratio on in vitro drug release from CPOP tablets in Sorensen’s phosphate buffer (pH 7.4) at 37 ± 0.5°C (mean ± S.D., n = 3)
SEM Micrographs
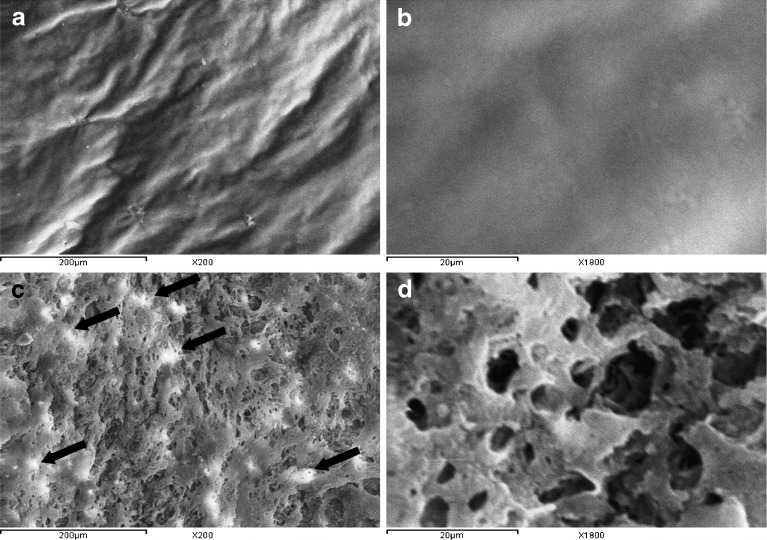
Figure 7 compares SEM micrographs of the coating membrane of the formula (F4–34) before and after the dissolution studies. Before contact with the dissolution medium, SEM micrographs (×200) revealed that the membrane has a rough and corrugated surface (Fig. 7a). No pores were observed, even after examination under higher magnification (×1,800; Fig. 7b). At the end of the dissolution studies, SEM micrographs (×200) revealed that the membrane became porous (Fig. 7c), possibly, due to the dissolution of PEG 400, a pore-forming agent, upon contact of the tablet with the dissolution medium. Similar observations were reported by Okimoto et al. (25) who concluded that the surface of CA membrane became more porous, as confirmed by SEM micrographs, by the addition of micronized lactose acting as a pore former.
Fig. 7.
SEM micrographs of the coating membrane of formula (F4–34) taken before (a [×200] and b [×1,800]) and after (c [×200] and d [×1,800]) dissolution studies for 24 h
Based on these observations, it could be suggested that release of the drug from CPOP tablets passes through the following steps: (a) dissolution of PEG 400 upon contact with the dissolution medium, (b) penetration of the tablet by the dissolution medium through the formed pores, (c) dissolution of the drug particles within the tablet, and (d) release of the drug through the pores. Appearance of traces of drug particles, indicated by arrows, on the surface of the coating membrane following dissolution studies (Fig. 7c) and its absence in the micrographs taken before dissolution studies (Fig. 7a) could be a possible evidence of this suggestion.
Examination of the coating membrane after dissolution studies under higher magnification (×1,800) was necessary to investigate the porous nature of the membrane. As shown in (Fig. 7d), the pores are characterized by two aspects, (a) surface pores that are formed from a series of open semi-ellipsoids or hemispheres and (b) inter-connecting channels that are formed from open surface pores that continued into the deeper layers.
In Vivo Absorption Studies
The in vitro release studies revealed that 98.32% of the drug was released from Napilac® capsules within 1 h. On the other hand, the rate of drug release could be efficiently extended for 24 h upon incorporation in CPOP tablets (formula F4–34). The pharmacokinetic parameters of etodolac following oral administration of the immediate-release Napilac® capsules as well as the sustained release CPOP tablets (formula F4–34) were evaluated in healthy human volunteers under the fasted condition (Table V) in an attempt to (a) investigate the in vivo success of the developed CPOP tablets in controlling the rate of drug release and (b) estimate the relative bioavailability percentage.
Table V.
Pharmacokinetic Parameters of Etodolac After Oral Administration of the Best Achieved CPOP Tablets (Formula F4–34) and the Commercial Immediate-Release Napilac® Capsules to Four Healthy Human Volunteers Under the Fasted Condition (mean ± S.D.)
| Formulae | C max (μg/ml) | T max a (h) | MRT (h) | K e (h−1) | t 50% (h) | AUC(0–24) (μg h/ml) | AUC(0–∞) (μg h/ml) |
|---|---|---|---|---|---|---|---|
| Napilac® capsules | 15.940 ± 2.902 | 1 | 6.623 ± 0.370 | 0.095 ± 0.023 | 7.627 ± 1.733 | 83.978 ± 12.551 | 92.083 ± 13.981 |
| Formula F4–34 | 6.408 ± 2.250 | 6 | 12.124 ± 0.533 | 0.029 ± 0.004 | 23.924 ± 2.668 | 77.220 ± 11.979 | 169.840 ± 19.213 |
aMedian
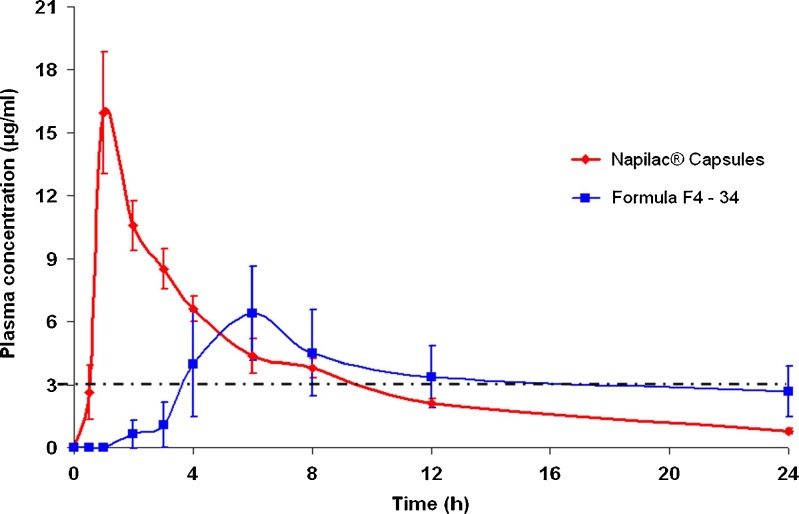
The drug plasma concentration–time profiles following oral administration of Napilac® capsules and CPOP tablets are depicted in Fig. 8. It is clear that the former formula showed higher mean Cmax (15.940 μg/ml) than the latter (6.408 μg/ml). This difference was proved to be statistically significant at P < 0.001.
Fig. 8.
Plasma concentration–time profiles of etodolac following oral administration of formula F4–34 and Napilac® capsules to four healthy human volunteers under the fasted condition (mean ± S.D.). The dashed line represents minimum effective concentration (MEC)
The estimation of other pharmacokinetic parameters (Tmax, MRT, and t50%) led to a conclusion that the latter formula successfully sustained the oral absorption of etodolac. This was manifested in (a) the delay in the median Tmax from 1 to 6 h, respectively, (b) the prolongation of MRT from 6.623 to 12.124 h, respectively, and (c) the prolongation of the mean elimination half-life of the drug from 7.627 to 23.92 h, respectively. These differences were proved to be statistically significant at P < 0.001.
The relative bioavailability, judged from the AUC(0–24), was found to be 91.95%. On the other hand, the relative bioavailability, judged from the AUC(0−∞), was found to be 184.422%. Similar findings were reported by Hu et al. (26) who found that relative bioavailability of the developed sustained release metformin hydrochloride pellets to the commercial immediate-release tablets was 165%. It was suggested that the sustained drug release pattern from the designed pellets would result in a prolonged drug input into the main absorption sites, located in the small intestine, in a manner that does not exceed their absorption ability and consequently results in enhanced bioavailability.
Etodolac is a preferential inhibitor of COX-2 enzyme, and consequently, it may produce less gastric toxicity than the non-selective NSAIDs such as naproxen. However, the intensity of the associated side effects like agranulocytosis, CNS disturbances, hepatotoxicity, and nephrotoxicity could be strongly related to the drug plasma level (1). The minimum effective plasma concentration of etodolac following oral administration, as reported by Shiro et al. (27), was 3.0 μg/ml. As shown in Fig. 8, following a lag time period of approximately 0.5 h, an effective etodolac plasma level was maintained for 9 h following oral administration of Napilac® capsules. On the other hand, the administration of formula F4–34 resulted in a significantly (P < 0.01) longer lag time period, approximately 3 h. However, the drug plasma levels were maintained at a therapeutic level for a much longer period of up to 18 h. This might be expected to reduce the intensity of the previously mentioned side effects commonly associated with the immediate-release preparations of etodolac.
CONCLUSIONS
In vitro delivery of more than 90% of etodolac over 24 h with nearly constant zero-order release kinetics was successfully achieved by optimization of the variables influencing the design of controlled porosity osmotic pump tablets of the drug. The rate of drug release from CPOP tablets could be tailored by controlling the osmotic pressure of the core tablet (osmogent type and drug/osmogent ratio), the composition of the coating solution, the membrane weight gain percentages, and the concentration of pore-forming agent. SEM micrographs confirmed the formation of pores in the coating membranes after coming into contact with the dissolution medium. When compared to the immediate-release Napilac® capsules, the best achieved CPOP tablets (formula F4–34) provided enhanced bioavailability and extended duration of effective etodolac plasma concentration with minimum expected potential for side effects. A more comprehensive pharmacokinetic study should be conducted, in the future, to confirm the obtained results.
REFERENCES
- 1.Sweetman SC. Martindale: the complete drug reference, 34th ed. London: The Pharmaceutical Press; 2005. [Google Scholar]
- 2.Theeuwes F. Elementary osmotic pump. J Pharm Sci. 1975;64:1987–91. doi: 10.1002/jps.2600641218. [DOI] [PubMed] [Google Scholar]
- 3.Sinchaipanid N, Pongwai S, Limsuwan P, Mitrevej A. Design of salbutamol EOP tablets from pharmacokinetics parameters. Pharm Dev Technol. 2003;8(2):135–42. doi: 10.1081/PDT-120018479. [DOI] [PubMed] [Google Scholar]
- 4.Theeuwes F, Wong DP, Bonsen P, Place V, Heimlich K, Kwan KC. Elementary osmotic pump for indomethacin. J Pharm Sci. 1983;72(3):253–8. doi: 10.1002/jps.2600720313. [DOI] [PubMed] [Google Scholar]
- 5.Liu L, Xu X. Preparation of bilayer-core osmotic pump tablet by coating the indented core tablet. Int J Pharm. 2008;352:225–30. doi: 10.1016/j.ijpharm.2007.10.047. [DOI] [PubMed] [Google Scholar]
- 6.Wakode R, Bhanushali R, Bajaj A. Development and evaluation of push–pull based osmotic delivery system for pramipexole. PDA J Pharm Sci Technol. 2008;62(1):22–31. [PubMed] [Google Scholar]
- 7.Kanagale P, Lohray BB, Misra A, Davadra D, Kini R. Formulation and optimization of porous osmotic pump-based controlled release system of oxybutynin. AAPS PharmSciTech. 2007;8(3):53. doi: 10.1208/pt0803053. [DOI] [PMC free article] [PubMed] [Google Scholar]
- 8.Okimoto K, Tokunaga Y, Ibuki R, Irie T, Uekama K, Rajewski RA, Stella VJ. Applicability of (SBE)7m-ß-CD in controlled-porosity osmotic pump tablets (OPTs) Int J Pharm. 2004;286:81–8. doi: 10.1016/j.ijpharm.2004.08.002. [DOI] [PubMed] [Google Scholar]
- 9.Makhija SN, Vavia PR. Controlled porosity osmotic pump-based controlled release systems of pseudoephedrine. I. Cellulose acetate as a semipermeable membrane. J Control Release. 2003;89:5–18. doi: 10.1016/S0168-3659(02)00482-0. [DOI] [PubMed] [Google Scholar]
- 10.Zentner GM, Rork GS, Himmelstein KJ. The controlled porosity osmotic pump. Ibid. 1985;1(4):269–82. [Google Scholar]
- 11.British Pharmacopoeia. British Pharmacopoeia Commission, HMSO, London. 2007. Electronic version.
- 12.Higuchi T. Mechanism of sustained action medication. J Pharm Sci. 1963;52:1145–9. doi: 10.1002/jps.2600521210. [DOI] [PubMed] [Google Scholar]
- 13.United States Pharmacopeia 32 & National Formulary 27. United States Pharmacopeial Convention, Inc., Rockville. 2009.
- 14.Shoukri RA, Ahmed IS, Shamma RN. In vitro and in vivo evaluation of nimesulide lyophilized orally disintegrating tablets. Eur J Pharm Biopharm. 2009;73:162–71. doi: 10.1016/j.ejpb.2009.04.005. [DOI] [PubMed] [Google Scholar]
- 15.Nafee NA, Ismail FA, Boraie NA, Mortada LM. Mucoadhesive delivery systems. II. Formulation and in-vitro/in-vivo evaluation of buccal mucoadhesive tablets containing water-soluble drugs. Drug Dev Ind Pharm. 2004;30(9):995–1004. doi: 10.1081/DDC-200037226. [DOI] [PubMed] [Google Scholar]
- 16.Liu L, Ku J, Khang G, Lee B, Rhee JM, Lee HB. Nifedipine controlled delivery by sandwiched osmotic tablet system. J Control Release. 2000;68:145–56. doi: 10.1016/S0168-3659(00)00243-1. [DOI] [PubMed] [Google Scholar]
- 17.Shokri J, Ahmadi P, Rashidi P, Shahsavari M, Siahboomi AR, Nokhodchi A. Swellable elementary osmotic pump (SEOP): an effective device for delivery of poorly water-soluble drugs. Eur J Pharm Biopharm. 2008;68:289–97. doi: 10.1016/j.ejpb.2007.06.006. [DOI] [PubMed] [Google Scholar]
- 18.Verma RK, Krishna DM, Garg S. Formulation aspects in the development of osmotically controlled oral drug delivery systems. J Control Release. 2002;79(1–3):7–27. doi: 10.1016/S0168-3659(01)00550-8. [DOI] [PubMed] [Google Scholar]
- 19.Kamba M, Seta Y, Kusai A, Ikeda M, Nishimura K. A unique dosage form to evaluate the mechanical destructive force in the gastrointestinal tract. Int J Pharm. 2000;208:61–70. doi: 10.1016/S0378-5173(00)00552-4. [DOI] [PubMed] [Google Scholar]
- 20.Bi Y, Mao S, Gan L, Li Y, Wang C, Xu N, Zheng Y, Cheng Q, Hou S. A controlled porosity osmotic pump system with biphasic release of theophylline. Chem Pharm Bull. 2007;55(11):1574–80. doi: 10.1248/cpb.55.1574. [DOI] [PubMed] [Google Scholar]
- 21.Jerzewski RL, Chien YW. Osmotic drug delivery. In: Kydonieus A, editor. Treatise on controlled drug delivery: Fundamentals, optimization, application. New York.: Marcel Dekker; 1992. pp. 225–53. [Google Scholar]
- 22.Grundy JS, Anderson KE, Rogers JA, Foster RT. Studies on dissolution testing of the nifedipine gastrointestinal therapeutic system. I. Description of a two-phase in vitro dissolution test. J Control Release. 1997;48:1–8. doi: 10.1016/S0168-3659(97)00064-3. [DOI] [Google Scholar]
- 23.Liu LX, Che BJ. Preparation of monolithic osmotic pump system by coating the indented core tablet. Eur J Pharm Biopharm. 2006;64:180–4. doi: 10.1016/j.ejpb.2006.05.004. [DOI] [PubMed] [Google Scholar]
- 24.Lu EX, Jiang ZQ, Zhang QZ, Jiang XG. A water-insoluble drug monolithic osmotic tablet system utilizing gum arabic as an osmotic, suspending and expanding agent. J Control Release. 2003;92:375–82. doi: 10.1016/S0168-3659(03)00371-7. [DOI] [PubMed] [Google Scholar]
- 25.Okimoto K, Ohike A, Ibuki R, Aoki O, Ohnishi N, Rajewski RA, Stell VJ, Irie T, Uekama K. Factors affecting membrane-controlled drug release for an osmotic pump tablet (OPT) utilizing (SBE)7m-ß-CD as both a solubilizer and osmotic agent. J Control Release. 1999;60:311–9. doi: 10.1016/S0168-3659(99)00077-2. [DOI] [PubMed] [Google Scholar]
- 26.Hu LD, Liu Y, Tang X, Zhang Q. Preparation and in vitro/in vivo evaluation of sustained-release metformin hydrochloride pellets. Eur J Pharm Biopharm. 2006;64:185–92. doi: 10.1016/j.ejpb.2006.04.004. [DOI] [PubMed] [Google Scholar]
- 27.Shiro K, Shigeru S, Hideaki O, Masayuki S, Koichi N, Kenichiro T, Yuji S, Fumio G. Oral etodolac, a COX-2 inhibitor, reduces postoperative pain immediately after fast-track cardiac surgery. J Anesth. 2004;18:9–13. doi: 10.1007/s00540-003-0215-3. [DOI] [PubMed] [Google Scholar]


