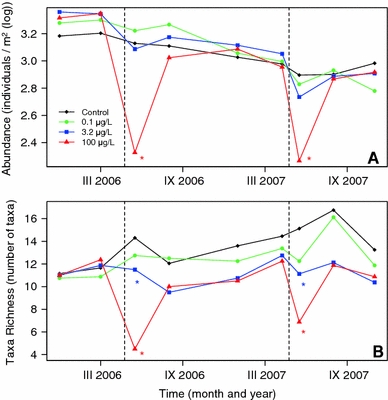
Fig. 1.

Abundance (a) and taxa richness (b) of aquatic macroinvertebrates (log(x + 1)-transformed number of individuals per square metre and number of taxa, respectively). Asterisks indicate significant (P < 0.05, ANOVA, Games–Howell post hoc tests) differences from the controls. Vertical dashed lines show contamination events
