
Fig. 2.
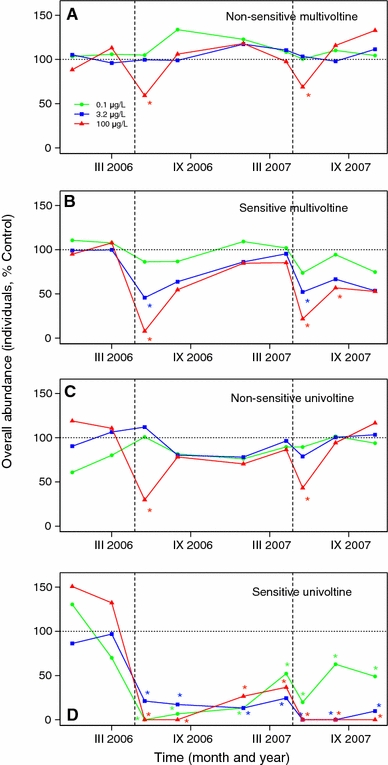
Abundance as a percentage of the control values for the four trait-based groups of aquatic macroinvertebrates: nonsensitive multivoltine (a), sensitive multivoltine (b), non-sensitive univoltine (c), and sensitive univoltine (d). Asterisks indicate significant (P < 0.05, ANOVA, Games–Howell post-hoc tests) differences from the controls. Vertical dashed lines show contamination events