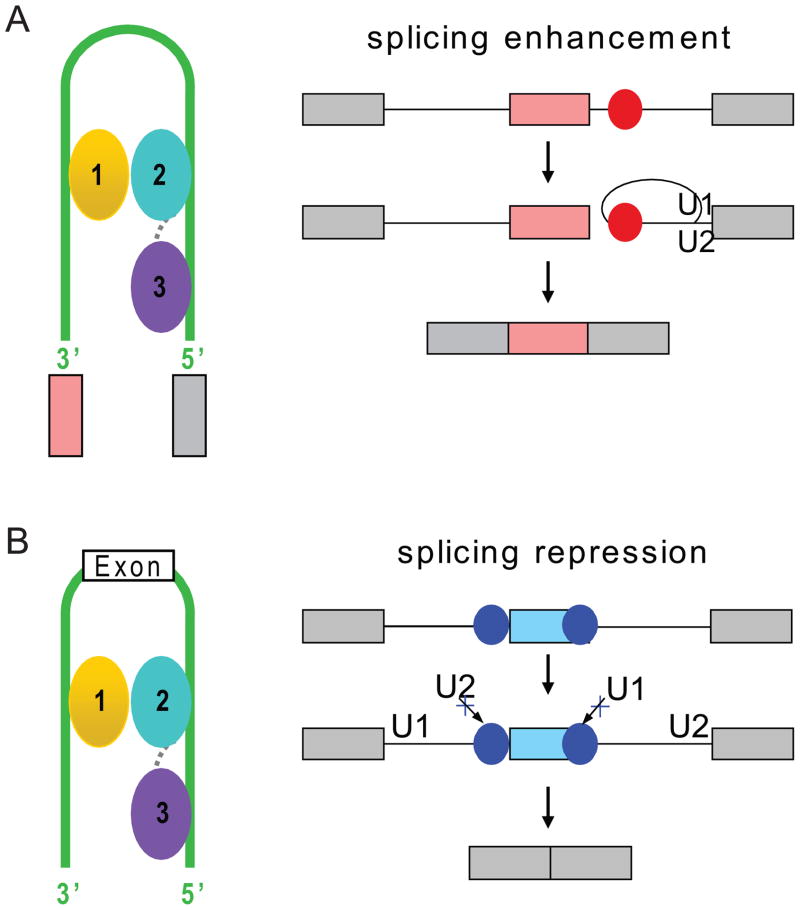
Figure 10. Models of RNA looping induced by Nova KH1–3 domains binding to splicing enhancers and splicing silencers predicted by Nova RNA map of splicing regulation (Ule et al., 2006).
(A) Model based on the examples of Nova upregulation of exon inclusion by binding to intronic splicing enhancer elements (red circles) to enhance spliceosome assembly.
(B) Model based on the examples of Nova inhibition of exon inclusion by binding to exonic splicing silencing element (blue circle) and blocking U1 snRNP (U1) assembly on the pre-mRNA, and Nova inhibition of exon inclusion by binding to intronic splicing silencing element immediately upstream of alternative exon by blocking recognition of the 3′ splice site by U2 snRNP (U2). KH1, KH2 and KH3 are colored gold, cyan and purple, respectively. The linkers between KH1 and KH2, and between KH2 and KH3 are represented by the dotted gray lines. The green line represents RNA loop.

