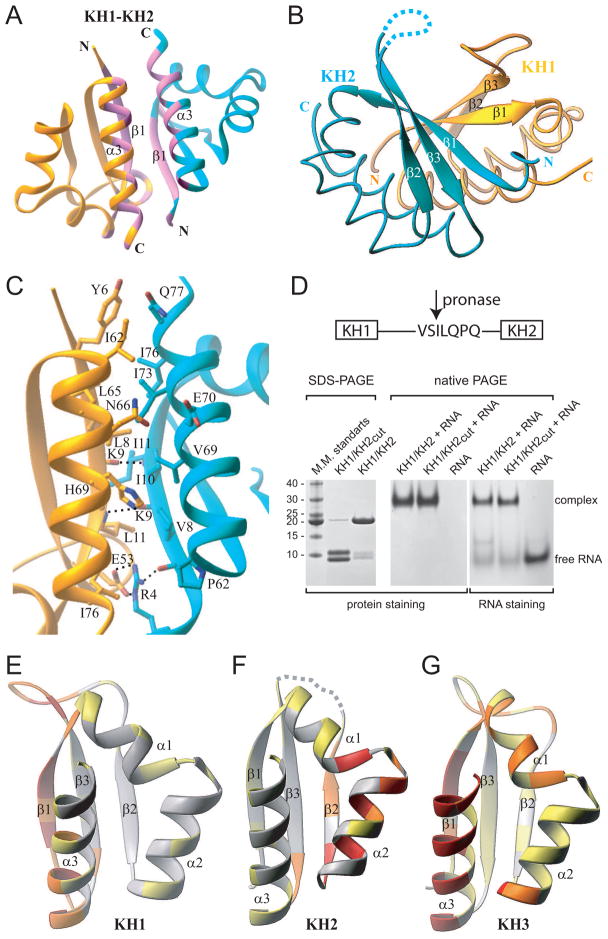
Figure 3. Ribbon Representations of KH1/2 Interface in the KH1/2-RNA Hairpin Complex and Distribution of the Protein-Protein Interaction Propensities over the Surface of Nova KH Domains.
(A) A global overview of the KH1(gold)/KH2(cyan) interface, with the segments constituting the interface, colored in pink.
(B) The three-stranded β-sheets of the KH1 and KH2 domains form a continuous twisted six-stranded β-sheet.
(C) Details of the KH1/2 interface, highlighting interactions between side chains of residues involved in inter-facial contacts.
(D) SDS-PAGE electrophoresis (left panel) showing pronase cleavage resulting in two protein fragments (cleavage at Ser90-Ile91 step) with molecular mass of approximately 9 and 10 kDa. Native PAGE (middle and right panels) establishing complex formation between KH1/KH2 and RNA, regardless of cleavage of the linker.
(E to G) Distribution of the protein-protein interaction propensities over the protein surface as calculated by the Optimal Docking Area (ODA) approach for three different KH domains. Ribbons representation of KH1 (panel E, present study) and KH2 domains of the Nova-1 KH1/2 protein (panel F, present study) and Nova-2 KH3 domain (panel G, Lewis et al., 2000). Structures are colored by the absolute magnitude of the ODA signal from the strongest in red, through medium in orange and weak in yellow, to the weakest in white.
See also Figure S5.

