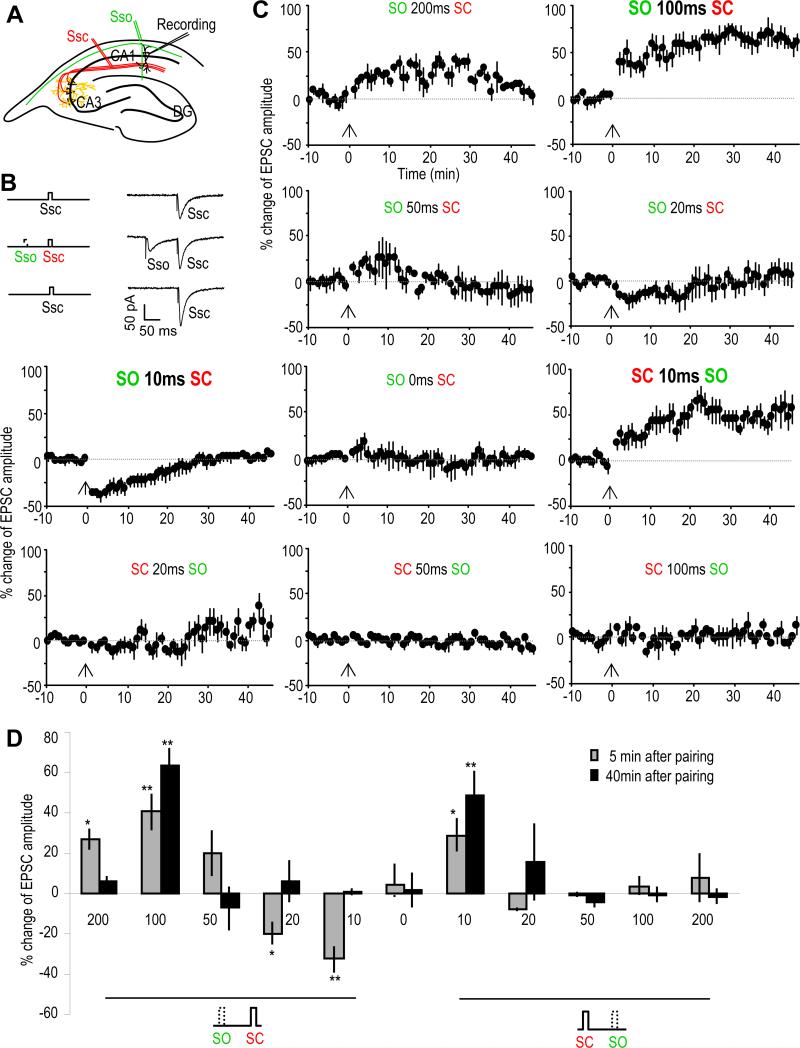
Fig. 1. SO stimulation induces various types of synaptic plasticity of SC-CA1 synapses.
(A) Schematic diagram showing the placement of recording and stimulating electrodes in the hippocampal slice. EPSCs were recorded from CA1 pyramidal neurons (Recording) by electrically stimulating the SC pathway (Ssc, in red). Cholinergic inputs were activated by electrically stimulating the SO (Sso, in green).
(B) Schematic diagram and sample EPSC traces showing the pairing of SC with SO (middle traces). The SC-EPSCs before (upper traces) and after the pairing protocol (lower traces) were monitored and analyzed.
(C) % change of SC-EPSC amplitude after pairing with the SO (introduced at the 0 min time point as indicated by the arrows) as compare with that before paring. Different types of plasticity were induced depending on the interval and the order of SC-SO pairing.
(D) Bar graph showing the % change of SC-EPSC amplitude 5 or 40 minutes after the pairing as compared with the baseline before the pairing. *p<0.05, **p<0.01, as compared with before pairing protocol, student t-test, n=5-7 in each group.
See also Figure S1.

