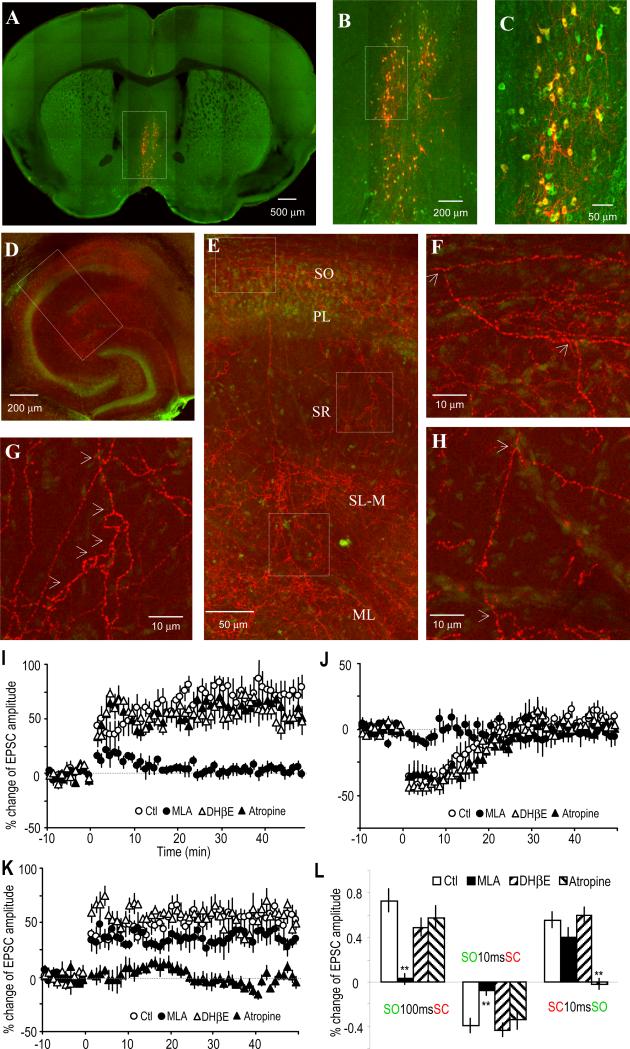
Fig. 5. Optogenetically activated cholinergic inputs induce dynamic synaptic plasticity of SC-CA1 synapses.
(A to C) Immunostaining of ChAT (green) in a coronal medial septal section showing that ChR2 (fused with mCherry, shown in red) was expressed exclusively in medial septal ChAT-positive neurons.
(D) Horizontal hippocampal slice showing the abundant presence of ChR2-expressing cholinergic terminals (mCherry, red) in hippocampus. The pyramidal layer is visualized with NeuroTrace fluorescent nissl stain (green).
(E) Inset from (D) showing the distribution of cholinergic terminals in different cell layers in (and near) the CA1 region.
(F to H) Insets from (E) showing the bifurcation (indicated by arrows) of the cholinergic terminals, suggesting the primary branches originated in the SO layer. The axon shown in (H) is extended from that in (F). PL, pyramidal cell layer; SL-M, stratum lacunosum-moleculare; ML, molecular layer of dentate gyrus.
(I) LTP was induced by optically activating the cholinergic input 100 ms before stimulating the SC, which was prevented by the α7 nAChR antagonist MLA, but not by the non-α7 nAChR antagonist DHβE nor the mAChR antagonist atropine.
(J) STD was induced by activating the cholinergic input 10 ms before the SC, which was also prevented by MLA, but not by DHβE nor atropine.
(K) LTP was induced by pairing the SC 10 ms before optically activating the cholinergic input, which was prevented by atropine, but not by MLA nor DHβE.
(L) Bar graph showing the three types of synaptic plasticity and the effects of the three AChR antagonists on the plasticity, respectively.
See also Figure S3.

