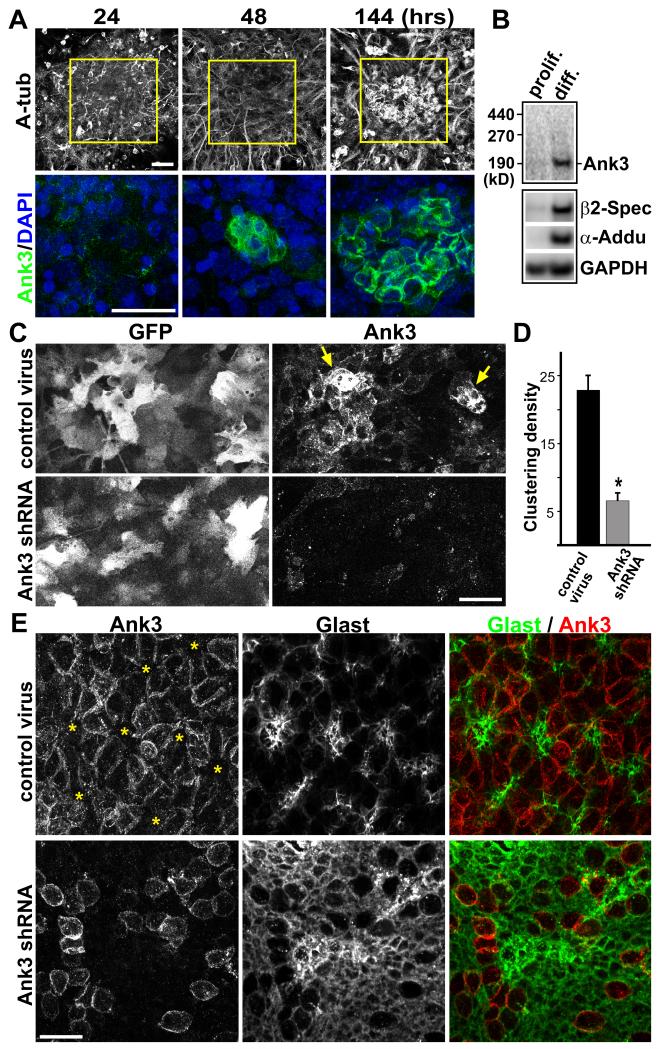
Figure 3. Ank3 regulation of postnatal SVZ niche formation.
(A) IHC staining showing Ank3 upregulation in clusters during in vitro differentiation of pRGPs (hrs after plating). (B) Western-blot analyses of Ank3, β2-Spectrin, α-Adducin protein levels in pRGP culture under proliferating (3 days after plating) and differentiating conditions (8 days after plating). (C) Control and Ank3 shRNA lentiviral infection of pRGPs in culture, showing knock-down of Ank3 upregulation (arrows). Note the high infection efficiency. (D) Quantification of ependymal cluster formation in culture after lentiviral infection (see text and Figure S4B for details). * p < 0.05 Wilcoxon 2-sample test; error bar = sem; n = 5. (E) IHC staining of P5 ventricular wall wholemounts after P0 lentiviral-injection. Note that while Glast expression in control sample is largely concentrated to the center of Ank3− pinwheel-like structures (asterisks), after Ank3 knockdown most pRGPs still expressed high level of Glast, and showed disorganization (see also Figure S4C). Scale bar: (A, C, E) 20 μm. See also Figure S3 and S4.

