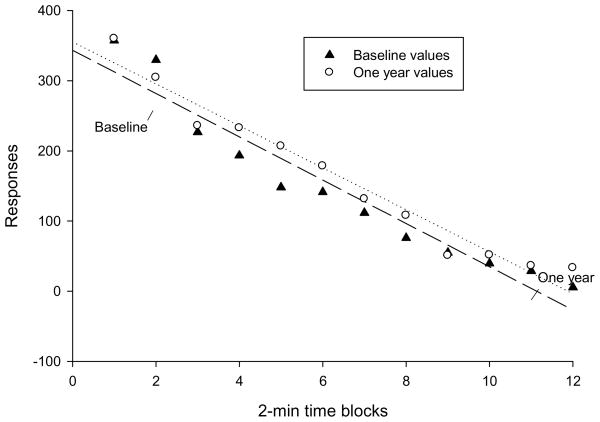
Figure 2.
Regression lines for responding over 12, 2-min time blocks for participants at baseline and after one year of follow-up. Mixed regression models showed a significant relationship between responding over time (p = 0.0002), with a slight increase in responding across 2-min blocks at one year (β = 0.04), but with minimal differences in the slope of the lines.

