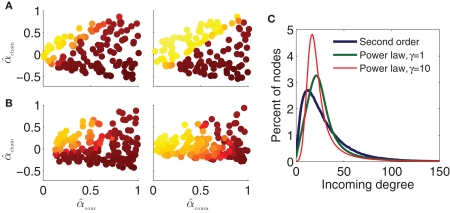
Figure 10.
Dependence of synchrony on first order connectivity statistics and higher order connectivity statistics. All simulations use the PRC model and coupling strengths S = 6 of the middle panel of Figure 9B. Note that changing p or N changes the effective coupling S/(pN) in the PRC model (17). Pseudocolor scale indicates synchrony as in Figure 9. (A) SONETs with different first order statistics. Left: sparse networks with N = 3000 neurons and connection probability p = 0.01. Right: large networks with N = 10000 neurons and connection probability p = 0.03. (B) Scale-free networks with N = 3000 neurons and connection probability p = 0.01. Rising exponents of degree distribution (7) γin/out were set to 1 (left) and 10 (right). For left panel, the minimum attainable value of αconv and αdiv was 0.1. Maximum degrees: bin = bout = 300. (C) Incoming degree distributions for networks with p = 0.01 and αconv = 0.7. The degree distributions are smoothed versions of the distribution of expected degree (7) as actual connections are generated randomly.

