Figure 6.
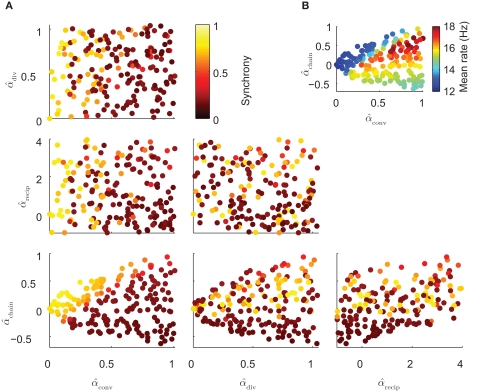
(A) Synchrony plotted as a function of pairs of connectivity statistics. The simulation results of the PRC model over the 186 SONETs (Figure 5) are replotted as a function of each pair of second connectivity statistics α estimated from the connectivity matrix using (3). Each dot corresponds to one network, and color indicates steady state synchrony measured by the order parameter (19). Synchrony varies smoothly in the graph with respect to αchain and αconv but not in the other graphs. (B) Average firing rate as a function of αchain and αconv for the same networks as in (A).

