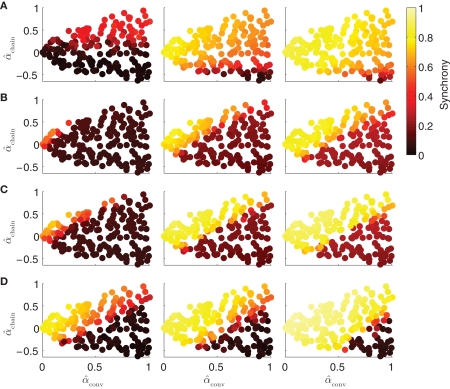
Figure 9.
Dependence of synchrony on model and coupling strength. Each row corresponds to a different neuron model, and coupling strength increases with column. Panels as in Figure 6A. (A) Kuramoto model (16) with coupling strengths S = 1, 2, and 3. (B) PRC model (17) with homogeneous parameters as in Figure 5. Coupling strengths were S = 3, 6, and 9, so that middle panel is the same as lower left of Figure 6. (C) Noise-free (σ = 0) PRC model (17) with heterogeneous parameters: ai was drawn from a Gaussian of mean 2 and SD 0.2; ωi was drawn from a Gaussian of mean 60 and SD 6. Coupling strengths were S = 3, 6, and 9. (D) Morris-Lecar model (18) with coupling strengths gsyn set to 20, 40, and 400 pS.

