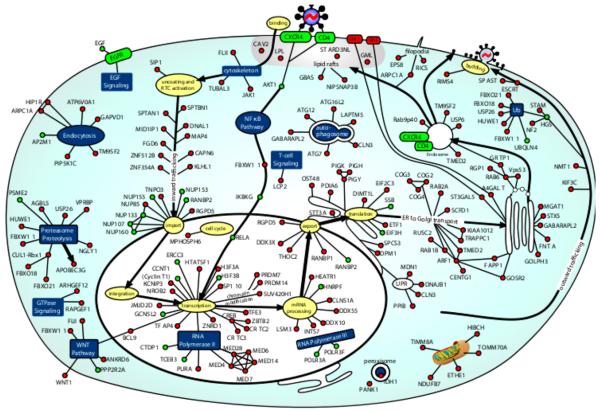
Fig. 2.
Image taken with permission from Brass et al. (2008) and modified. Nodes are HDFs found by Brass et al. (2008). Green nodes are HDFs for which we predict PPIs at the 1:25 PE:NE ratio. Red nodes are HDFs for which we do not predict PPIs. For the sake of clarity, we do not show predicted HIV interactors in the image. (For interpretation of the references to color in this figure legend, the reader is referred to the web version of the article.)

