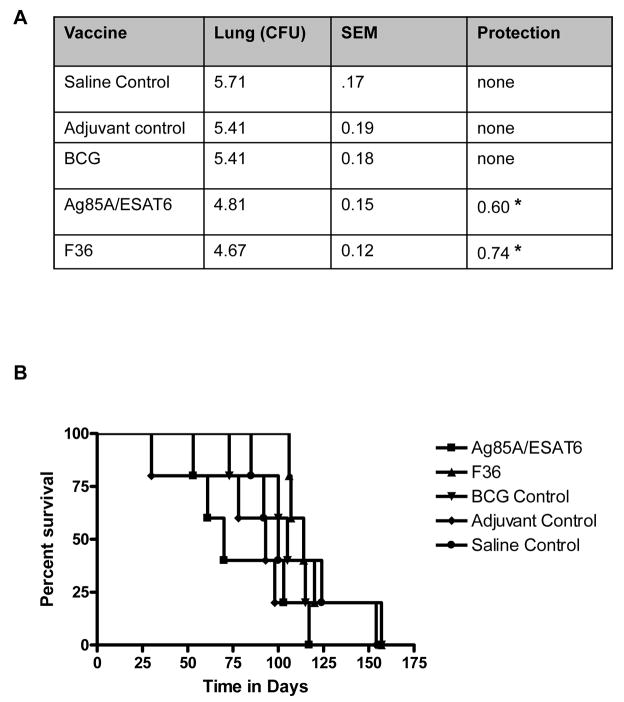
Figure 1.
Bacterial growth in the lungs and Kaplan-Meier analysis of the survival of guinea pigs infected with M. tuberculosis and receiving post-exposure vaccines. Bacterial counts in the lungs (panel A), on day 40 from guinea pigs infected with a low dose of M. tuberculosis and receiving post exposure vaccine 10 days after infection were compared. Results are expressed as the average (n=5) of the bacterial load in each group expressed as Log10CFU, standard error mean (SEM) and protection. Median survival days (panel B) of Hartley guinea pigs (n=10) vaccinated with, Ag85/ESAT6 (solid square), F36 (solid triangle), BCG control (solid inverted triangle), adjuvant control (solid diamond), and saline control (solid circle) are compared.

