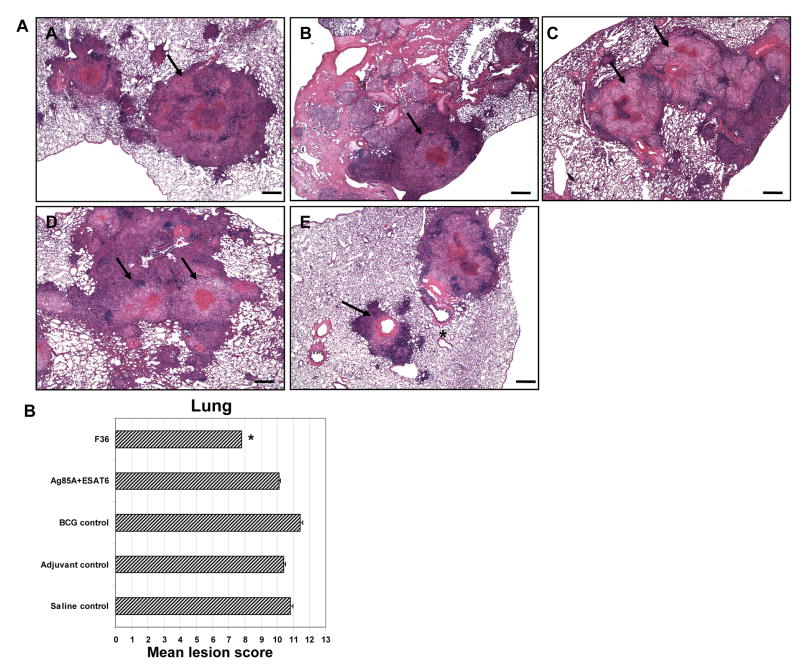
Figure 2.
Light photomicrographs of lungs (panel A, A–E) from representative guinea pigs that were guinea pigs infected with M. tuberculosis and receiving post-exposure vaccines saline control (A, A), adjuvant control (A, B), BCG control (A, C), Ag85A+ESAT6 (A, D) and F36 (A, E) on day 40 are shown. [bar denotes H&E staining, 20X]. The lesion scores (panel B) of lungs were calculated as described in Materials and methods section for all the four groups on day 40 of the infection. The scores are presented as total mean lesion values. On day 40, smaller lesions (arrows) and reduced lesion scores were seen in the animals vaccinated with the F36 fusion protein compared to the saline control, adjuvant control, BCG control, Ag85A+ESAT6. Results are expressed as the mean lesion scores (±SEM, n=4). (Student t-test, *p≤0.05) compared to adjuvant control guinea pigs.

