
Figure 1.
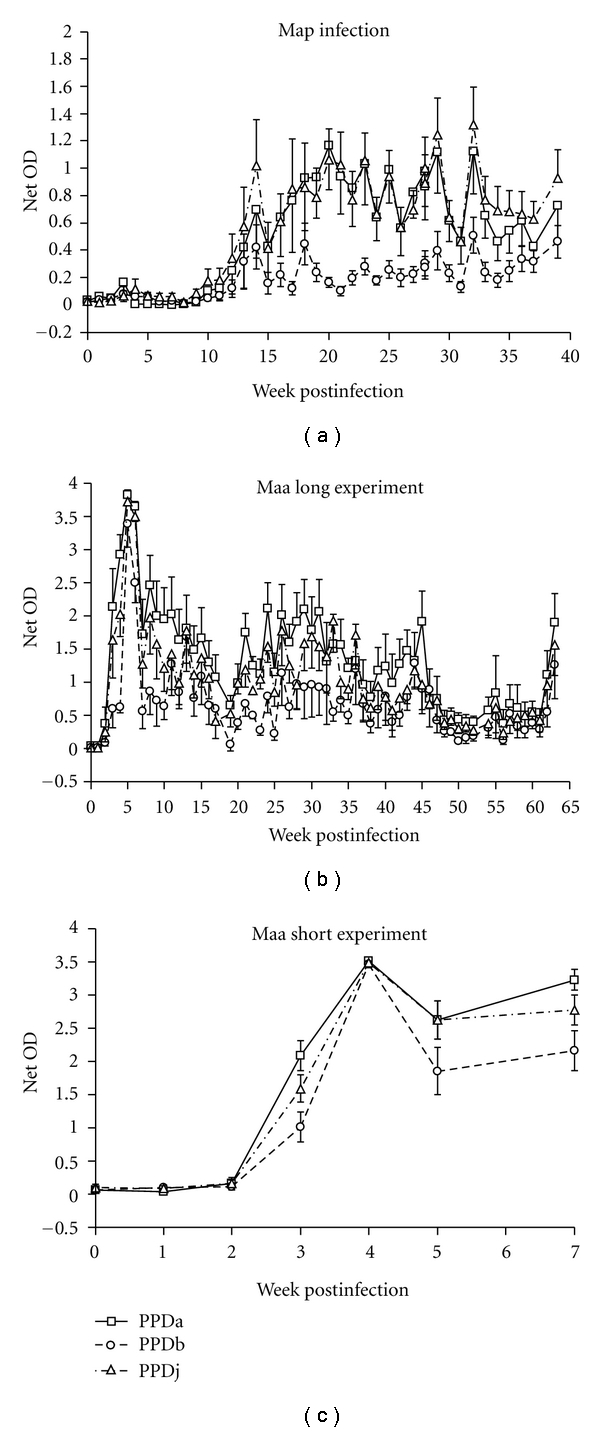
(a) Mean IFN-γ net OD values from whole blood stimulated with PPDa, PPDb, and PPDj tuberculins from 12 Map-exposed calves over 39 weeks. For clarity, only one side of the standard error of measurement bar is shown for PPDa and PPDj data points. (b) Mean IFN-γ net OD values from whole blood stimulated with PPDa, PPDb, and PPDj tuberculins from 6 Maa-exposed calves over 64 weeks. (c) Mean IFN-γ net OD values from whole blood stimulated with PPDa, PPDb, and PPDj tuberculins from 12 Maa-exposed calves over 7 weeks.