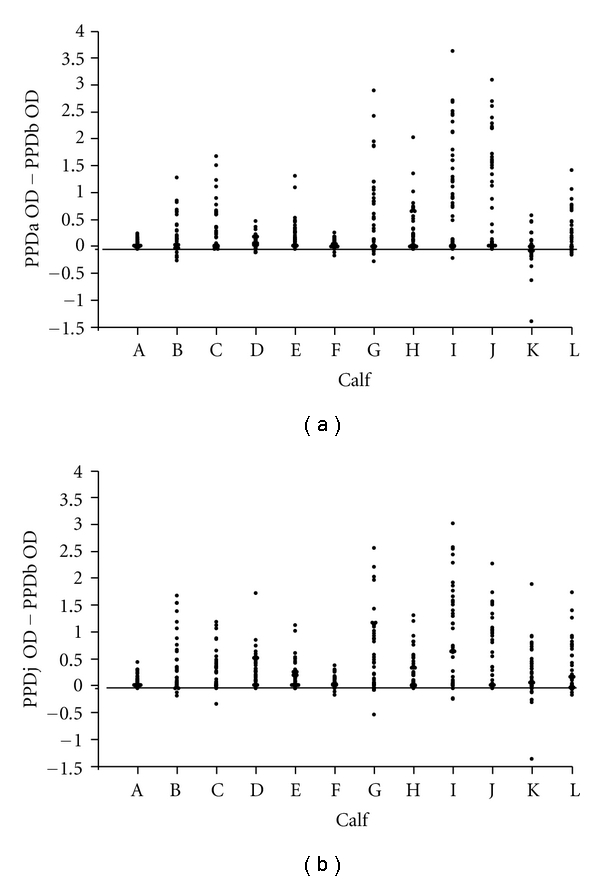
Figure 2.

(a) Difference between IFN-γ responses to PPDa and PPDb over the course of experiment 1 at weekly intervals with Map exposed cattle. A cut-off of −0.05 OD has been applied to highlight cattle with a higher response to PPDb than PPDa. (b) Difference between IFN-γ responses to PPDa and PPDb over the course of experiment 1 at weekly intervals with Map-exposed cattle. A cut-off of −0.05 OD has been applied to highlight cattle with a higher response to PPDb than PPDj.
