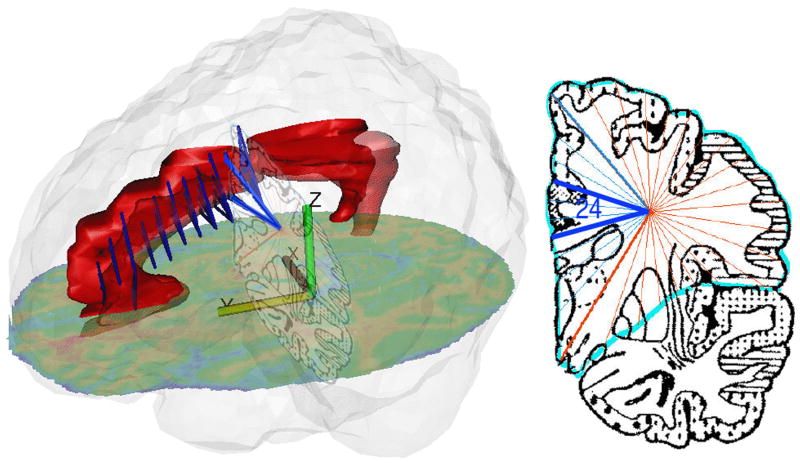
Figure 4.
Assessment of gray matter volume of Brodmann area 24. Left: Cingulate (hand-traced on MRI) is shown as red volume. Perry atlas slices 6 to 16 are shown in perspective as blue triangles, from sector point at frontal lobe center to Brodmann area 24. Right: Perry atlas slice 15 with area 24 marked. Perspective slightly distorted to provide clearer view of Perry atlas slice.

