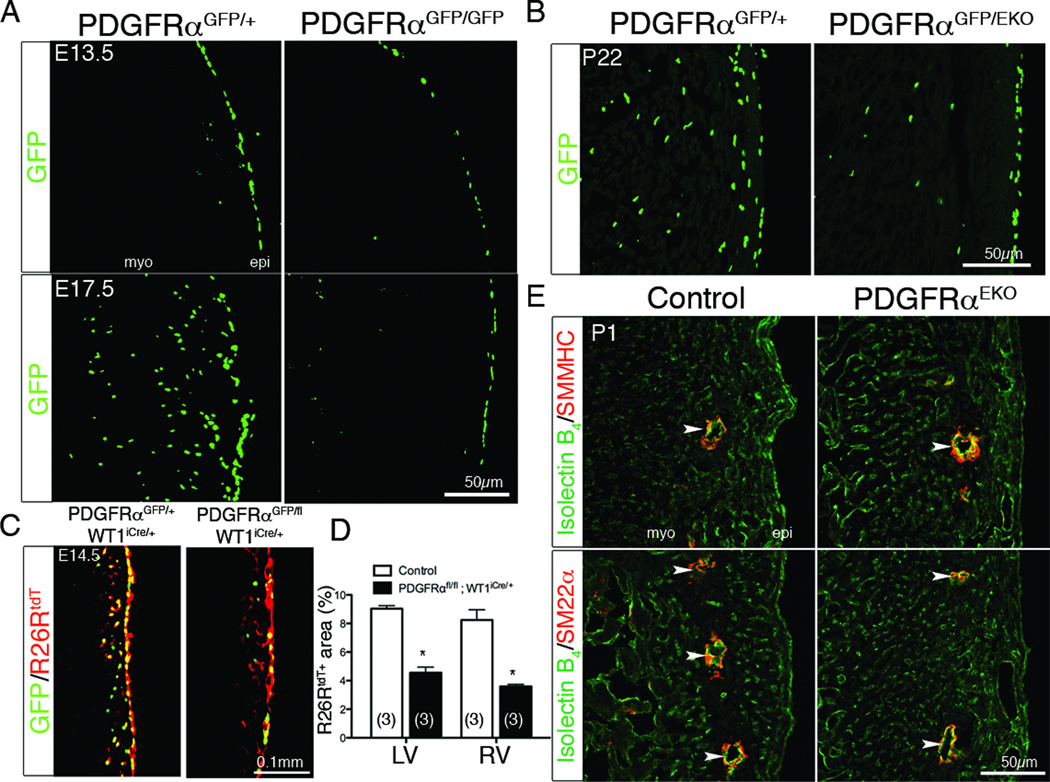
Figure 5. PDGFRα epicardial phenotype.
(A–B) GFP fluorescence was used to follow PDGFRα expressing cells in the indicated genotypes. (C) Confocal images of R26RtdT and PDGFRαGFP fluorescence of the indicated genotypes induced with tamoxifen at E12.5. (D) Quantification of R26RtdT fluorescent area in (C). (*) p<0.001 (E) IHC for coronary endothelial cells (Isolectin B4) and cVSMC (SMMHC and SM22α). (epi – epicardium, myo – myocardium Arrowheads denote coronary vessels).

