
Figure 2. Unfolding Monitored by CD Spectroscopy.
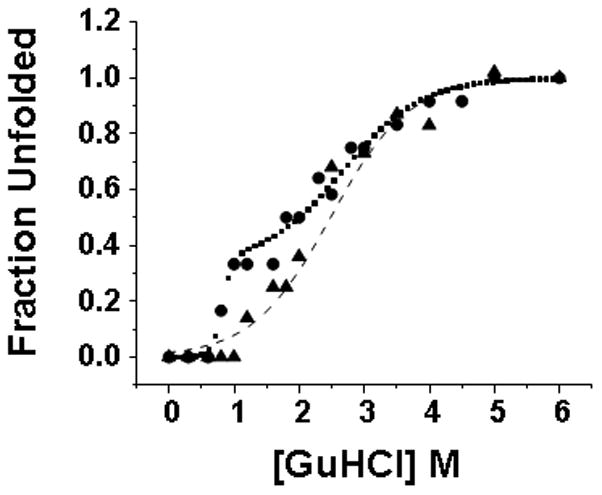
Unfolding of recombinant (filled circles) and plasma (filled triangles) α1-AT. Recombinant data was fit to a 3-state unfolding model (dotted line) while plasma was fit to a 2-state model (dashed line).