
Figure 3.
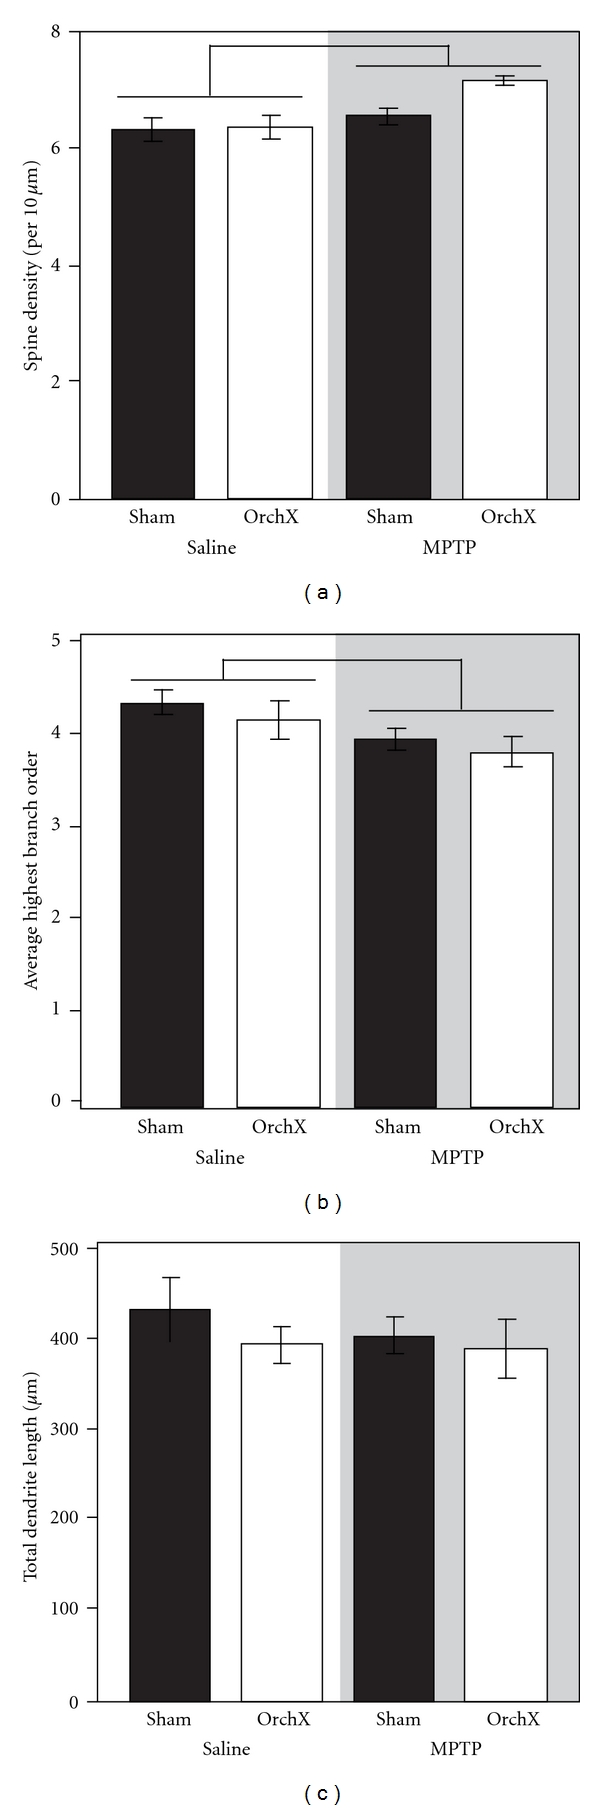
Neuronal morphology totals. Total spine density (a), average highest branch order (b), and total dendrite length (c) in saline-injected (unshaded panel) and MPTP-treated (shaded panel) gonad-intact (black bars) and orchidectomized (white bars) male mice (n = 5 mice/group). Bars represent an effect of MPTP (P < .05). OrchX: orchidectomized; Sham: sham-orchidectomized.