
Figure 2. A nutrient sensitized screen to discover agents that shift energy metabolism.
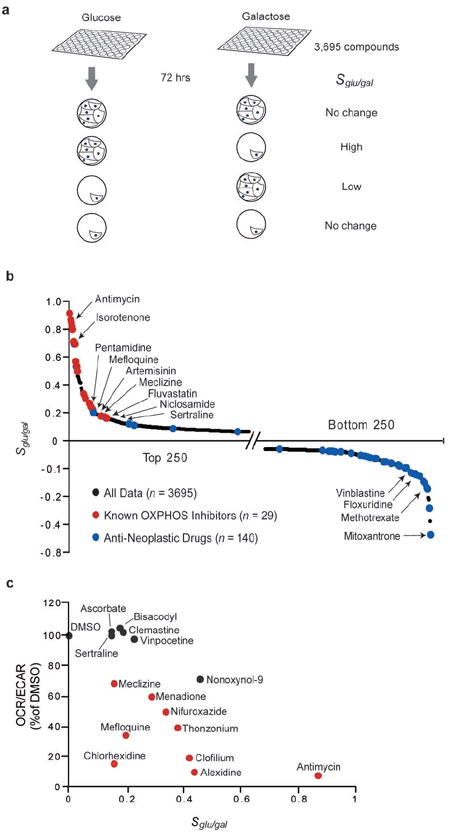
(a) Schematic of the drug screen. MCH58 cells grown in 96 well plates in glucose or galactose containing media are exposed to a chemical library of 3695 compounds for 72 hours. The logarithm of the normalized cell number in glucose versus galactose serves as a summary statistic (Sglu/gal) for each compound.
(b) Results from a nutrient sensitized screen. Sglu/gal is plotted for top and bottom 250 compounds. Known oxidative phosphorylation (OXPHOS) inhibitors are highlighted in red and anti-neoplastic drugs are highlighted in blue.
(c) Secondary assays to evaluate compounds with modest yet positive Sglu/gal scores. The OCR/ECAR ratio of selected compounds is plotted against the compounds’ corresponding Sglu/gal score from panel (b). OCR and ECAR measurements were made on MCH58 cells grown in glucose and are normalized to cell viability. Compounds indicated by red symbols exhibited a statistically significant decrease in the OCR/ECAR ratio based on at least three independent replicates (P<0.05; two-sided t-test).