
Figure 1.
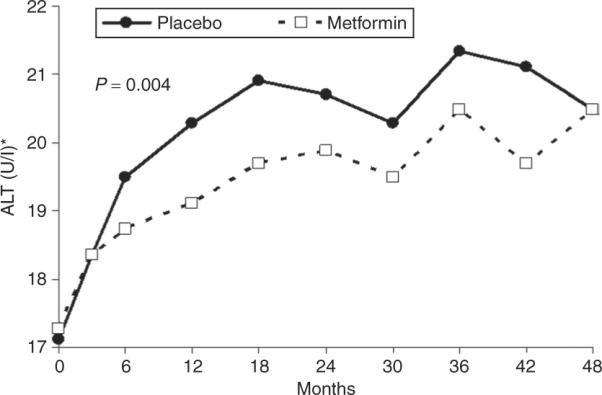
Mean ALT concentrations over time in study. ALT presented as geometric means. Overall difference in ALT values compared by treatment group using repeated-measures analysis of variance.
Official websites use .gov
A
.gov website belongs to an official
government organization in the United States.
Secure .gov websites use HTTPS
A lock (
) or https:// means you've safely
connected to the .gov website. Share sensitive
information only on official, secure websites.
Mean ALT concentrations over time in study. ALT presented as geometric means. Overall difference in ALT values compared by treatment group using repeated-measures analysis of variance.