
Figure 4.
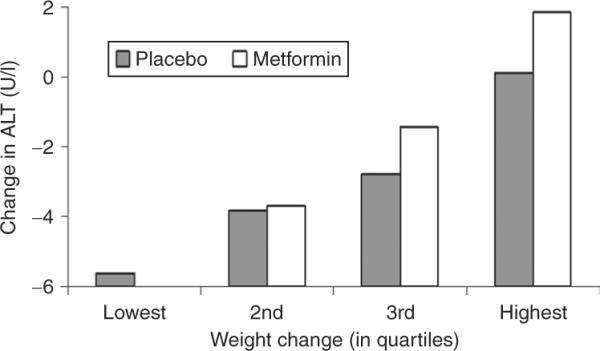
Mean ALT concentration by quartile of change in weight over study. Quartiles by change in weight by end of study, quartile 1 (lowest) representing those with most weight loss.
Official websites use .gov
A
.gov website belongs to an official
government organization in the United States.
Secure .gov websites use HTTPS
A lock (
) or https:// means you've safely
connected to the .gov website. Share sensitive
information only on official, secure websites.
Mean ALT concentration by quartile of change in weight over study. Quartiles by change in weight by end of study, quartile 1 (lowest) representing those with most weight loss.