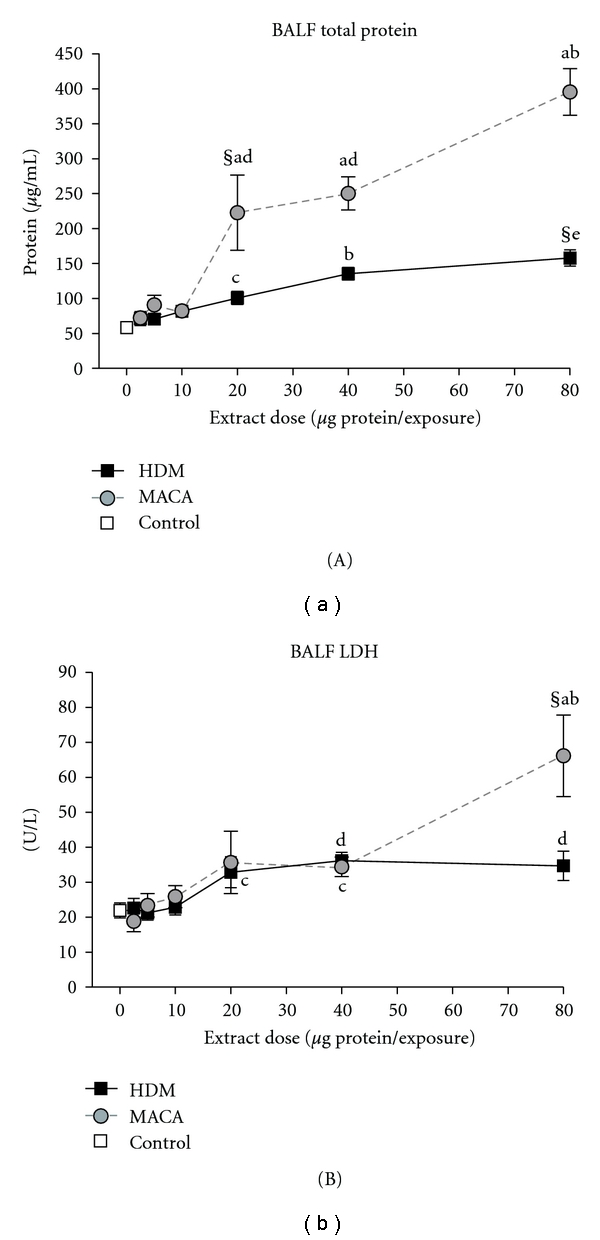
Figure 3.

Total protein levels (A), and LDH activity (B) in BALF collected 3 days after the final exposure to HDM or MACA. Symbols indicate (§) the lowest significant dose compared to HBSS (0 dose control), statistically significant differences (a) between extracts at the same dose, (b) from all lower doses within treatment, (c) from 2.5 μg and 5 μg doses within treatment, (d) significantly different from 2.5 to 10 μg doses within treatment, or (e) significantly different from 2.5 to 20 μg doses within treatment (P < .05). Error bars represent standard error of the mean. Control n = 12; HDM and MACA n = 5-6.
