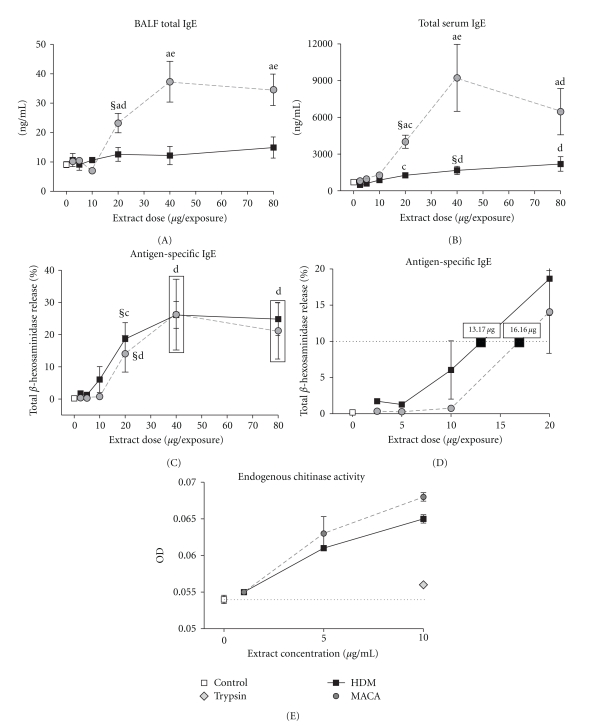
Figure 5.
BALF (A) and Serum (B) total IgE levels of HDM- or MACA-exposed mice collected 3 days after the final exposure. (C) Antigen-specific IgE indicated by % of RBL cells total beta-hexosaminidase release across the dose range after incubation with serum (1 : 4 dilution) obtained from HDM- or MACA-exposed mice. (D) A detail of the antigen-specific IgE dose-response displaying the extract doses calculated to result in 10% of total beta-hexosaminidase release (dashed line). (E) The endogenous chitinase activity in the MACA and HDM extracts. Symbols indicate (§) the lowest significant dose compared to HBSS (0 dose control), statistically significant differences (a) between extracts at the same dose, (b) from all lower doses within treatment, (c) from 2.5 μg and 5 μg doses within treatment, (d) significantly different from 2.5 to 10 μg doses within treatment, (e) significantly different from 2.5 to 20 μg doses within treatment (P < .05). Error bars represent standard error of the mean. Control n = 12; HDM and MACA n = 5-6.

