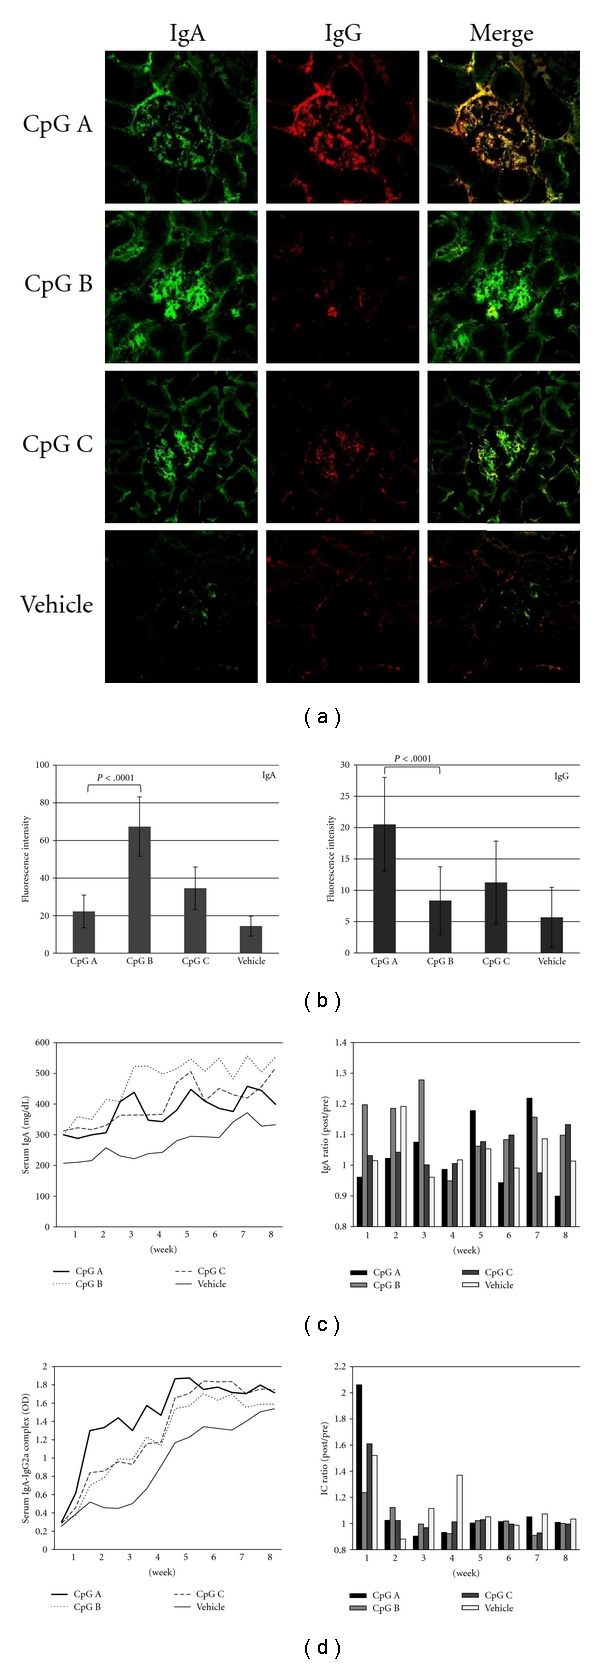
Figure 2.

Glomerular deposition and serum levels of IgA, IgG, and IgA/IgG immune complexes (IC). (a) Immunofluorescence staining of IgA and IgG in the glomeruli of each CpG-ODN group. (b) Fluorescence intensity of IgA and IgG in glomeruli. The fluorescence intensity of each immunoglobulin was evaluated in more than 30 glomeruli. (c) Serum IgA (mg/dL) and (d) IgA-IgG2a IC (OD). The ratios of pre/post administration for IgA and IgA-IgG2a IC were also evaluated. Magnification in (a): 400X.
