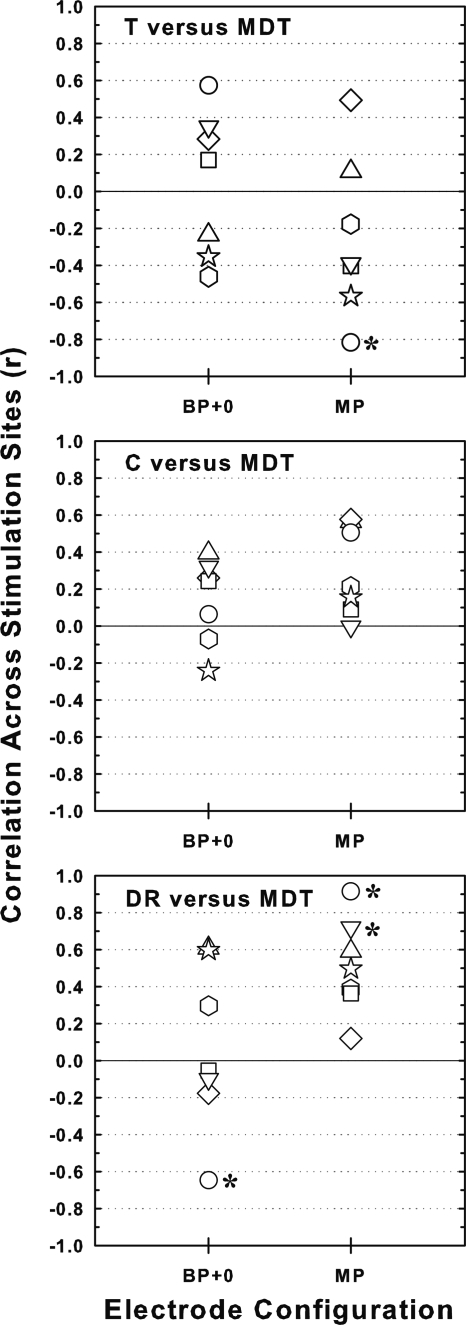
Figure 5.
Correlations across stimulation sites of MDTs with three loudness-related measures: T levels in the top panel, C levels in the middle panel, and dynamic ranges (DRs) in the bottom panel. Correlations for BP + 0 stimulation are shown on the left and those for MP stimulation are shown on the right. Open symbols identify the individual subjects (see legend in Fig. 2). Asterisks indicate statistically significant correlations (p < 0.01).

