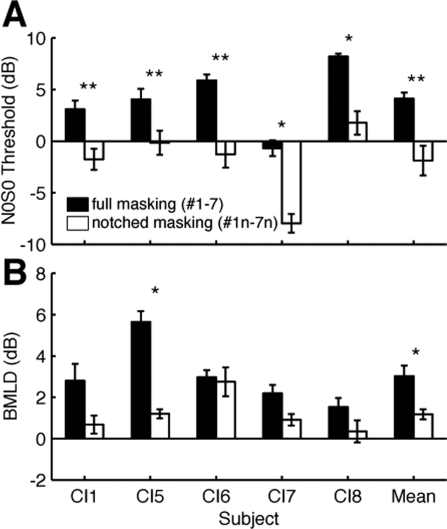
Figure 5.
Full vs notched masking. (A) N0S0 thresholds are represented on the y-axis. Subjects and group average are listed on the x-axis. (B) BMLD. Data are grouped by subject and averaged over electrode configuration. Black bars represent conditions where noise was presented on the target electrode (MEC #1–7). White bars indicate conditions where masking noise was only presented on electrodes adjacent to the target electrode (MEC #1n–7n). Error bars are standard errors. Statistically significant differences between the two conditions are marked with *(paired t-test, p < 0.05). Mean and the associated error bars indicate average data and standard error. Data were averaged over subject first and then over MEC.

