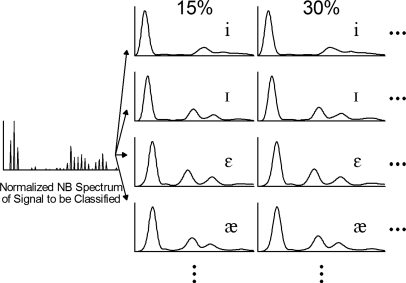
Figure 8.
Sketch of the recognition method used by the narrow band model. The normalized narrow band spectrum computed at 15% of vowel duration is compared to the 12 vowel templates computed at the same time point (only four of which are shown here). The narrow band input spectrum at 30% of vowel duration (not shown) is then compared to the 12 vowel templates computed at 30% of vowel duration, and so on (from Hillenbrand and Houde, 2003).

