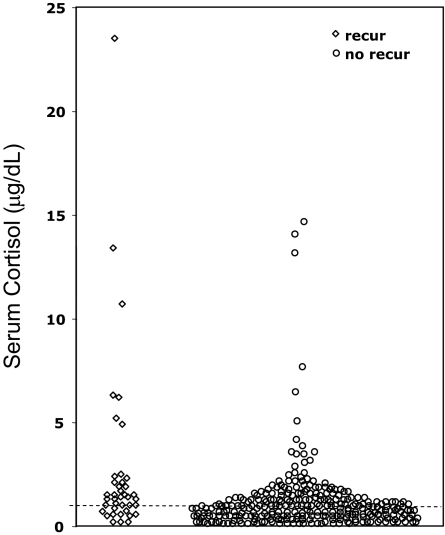
Fig. 2.
Individual nadir serum cortisol on d 3, 4, and 5 after TSS, stratified according to long-term follow-up remission status (♢, recurrence; ○, remission). (To convert to nanomoles per liter, multiply by 27.6.) Cortisol values of 1 μg/dl or undetectable are shown at or below the dashed line at 1 μg/dl.

