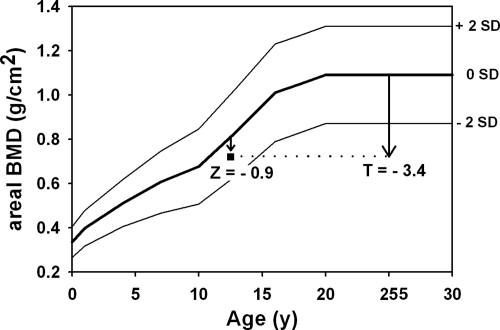
Fig. 2.
BMD Z-score and T-score for a 12-yr-old child (23). The curves demarcate the normal (mean ± 2 sd) areal BMD of the lumbar spine, which depends on skeletal size and thus increases with age. The square symbol represents a patient who received an erroneous diagnosis of osteoporosis based on a low T-score. The Z-score of this patient is well within the normal range for age.

