
Figure 2.
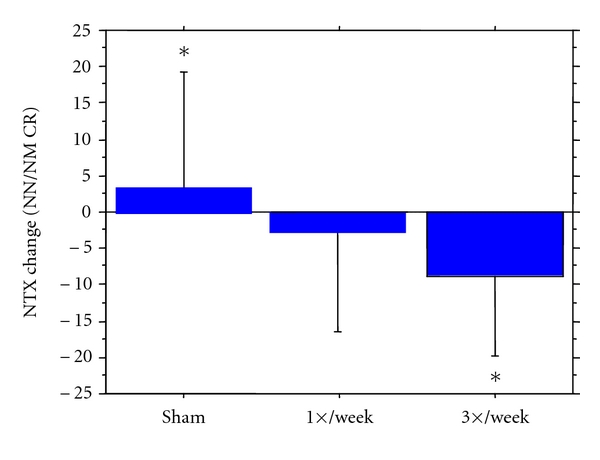
Group effect: Absolute changes in NTx/Cr (nm/mmCr) values presented as Mean ± SD. Analysis by ANCOVA model with changes score as dependent variable and group assignment, baseline value of Ntx/Cr, age, height, use of HRT, and years since menopause as independent variables. Group effect for model was P < .05, post-hoc pair-wise comparisons analyzed by post-hoc LSD t-tests. *Indicates significance (P < .018) between the Sham and 3×/week group.