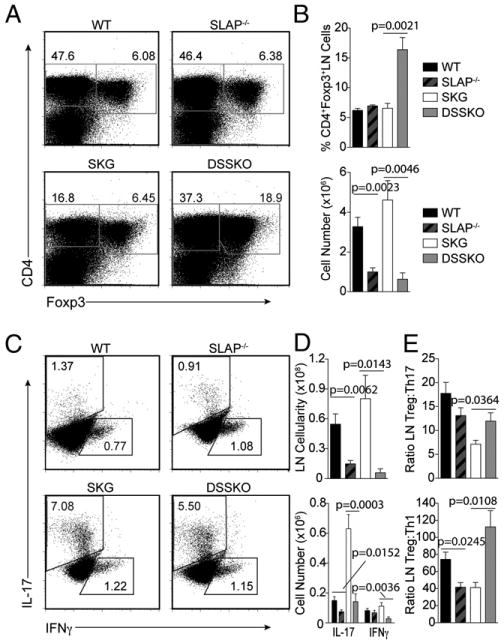
Figure 4.

Increased numbers of Tregs and decreased numbers of Th1 and Th17 cells in DSSKO mice after zymosan exposure. A, Representative flow plots of Tregs in the LNs of WT, SLAP−/−, SKG, and DSSKO mice 10 wk after zymosan exposure. B, Frequency and absolute number of LN Tregs in each group as shown in A. C, Intracellular staining of IL-17 and IFN-γ in CD4+ cells from the LNs of WT, SLAP−/−, SKG, and DSSKO mice 10 wk after zymosan exposure. D, Frequency and absolute number of IL-17 and IFN-γ expressing CD4+ LN cells from each group as shown in C. E, Ratio of Tregs compared with Th17 or Th1 cells in zymosan-treated mice. Data represent the average of 7 to 10 mice per genotype (±SEM) from three independent experiments.
