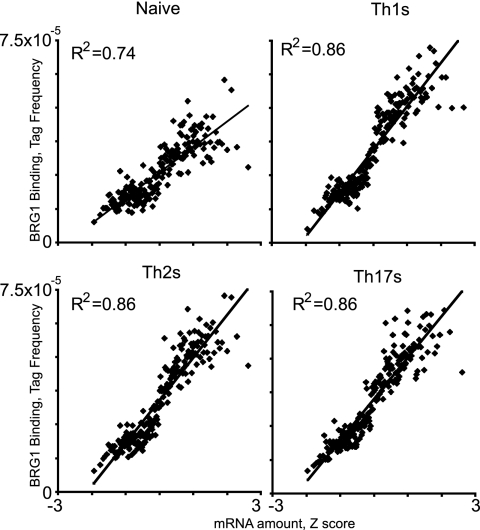
Fig. 2.
BRG1 binding positively correlates with gene activity in T helper cells. ChIP-seq and expression data were compared essentially as described previously (6). Genes were sorted based on gene expression values (Z scores) and binned into groups of 100 genes, and the average gene expression value for each bin was calculated. After BRG1 tags in binding regions were assigned to the nearest transcriptional start site, the BRG1 tags contained by the genes in each bin was counted, and the average value was calculated. BRG1 binding in naïve, Th1S, Th2S, and Th17S cells was graphed against gene expression for each bin. All graphs were scaled to the same tag frequency and Z score range to facilitate direct comparison. Gene expression data were published previously (85).

