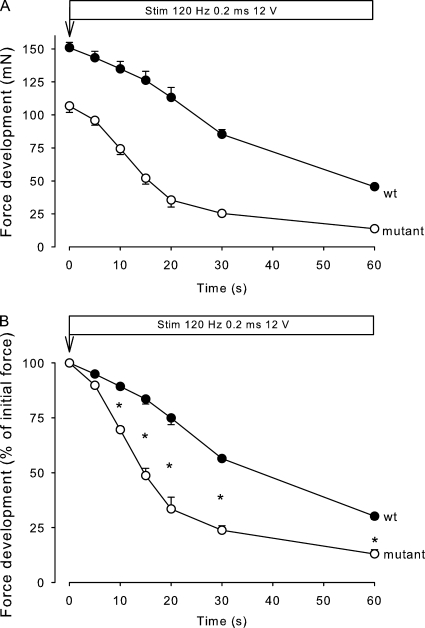
Figure 2.
Effect of continuous stimulation on force development in soleus from 5.5-wk-old mice. Experimental conditions as described in the legend to Fig. 1. Each point shows the mean of observations on three muscles, with error bars denoting SEM. The asterisks indicate the significance of differences between WT and mutant muscles (P < 0.001).

