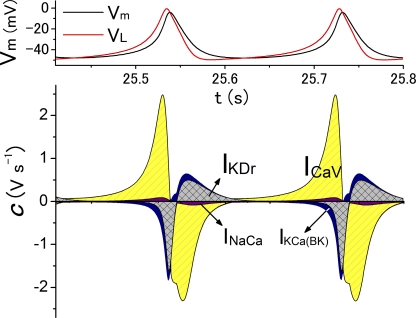
Figure 6.
VL diagram for two successive action potentials within the burst at 8 mM [G]. (Top) Time-dependent changes of VL (red) and Vm (black). Note that VL always changes in advance of Vm. (Bottom) Time-dependent changes in contributions (c) of ICaV, IKDr, IKCa(BK), and INaCa. The c of other currents was also plotted in the diagram but is barely visible because of its minor contributions. The time scale on the x axis refers to that in Fig. 4 A.

