Figure 1.

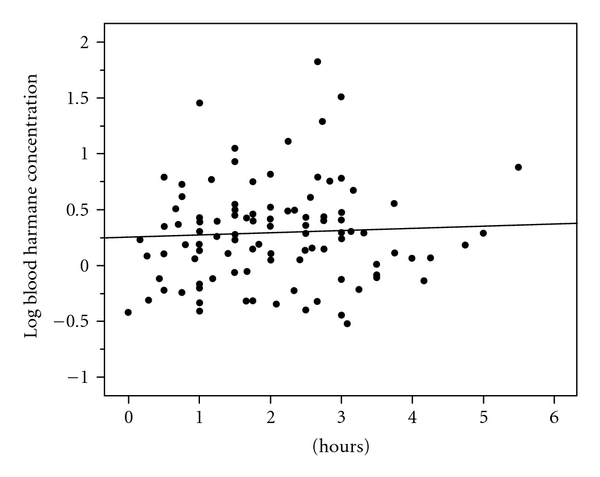
Hours between food consumption and phlebotomy (x axis) and log blood harmane concentration (g−10/ml) (y axis). Regression line is shown (Spearman's r = 0.03, P = .74).

Hours between food consumption and phlebotomy (x axis) and log blood harmane concentration (g−10/ml) (y axis). Regression line is shown (Spearman's r = 0.03, P = .74).