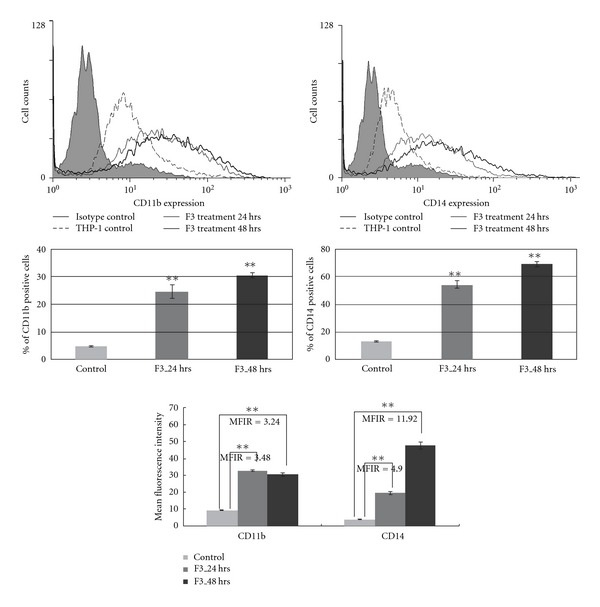
Figure 4.

Flow cytometry detection of CD11b and CD14 expression in leukemia cells upon treatment with F3. The results were collected as either percentage of positive cells or MFI values subtracted by the MFI of isotype control antibody-stained cells. The results are the representation of three independent experiments showing similar results. Values were shown as mean ± SD and individual Student's t-test was performed between F3-treated THP-1 cells and untreated control (**P < .001). MFIR: mean fluorescence intensity ratio.
